Drystack Survey Highlights Facility Infrastructure and Operations
Published on March 18, 2020Editor’s Note: In January and February 2020, Marina Dock Age magazine surveyed dry storage facilities across the country via its online survey program. Drystacks answered questions about infrastructure, operations, boat accommodations, boater services and more.
Respondent Profile
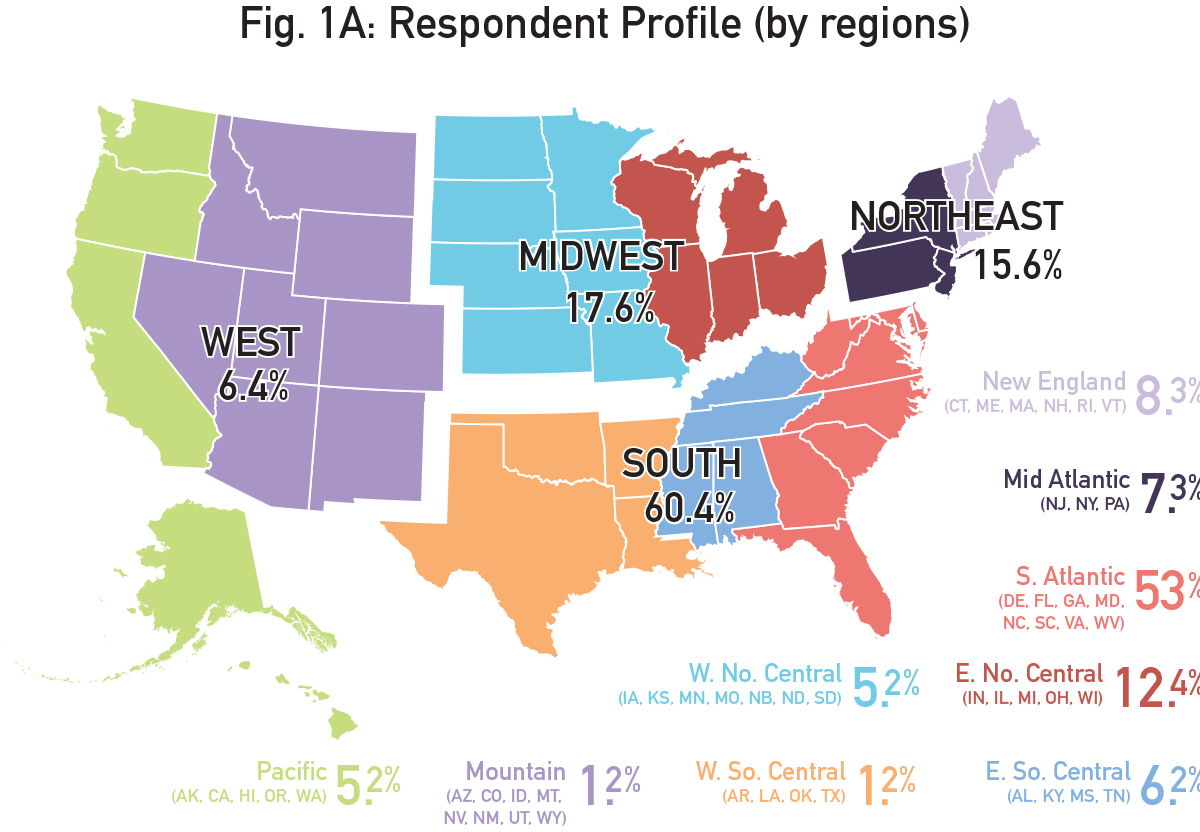
The map on this page shows the distribution of respondents across the country, nine smaller regions and four larger ones. The majority of drystack facilities are in the South Atlantic region (53%).
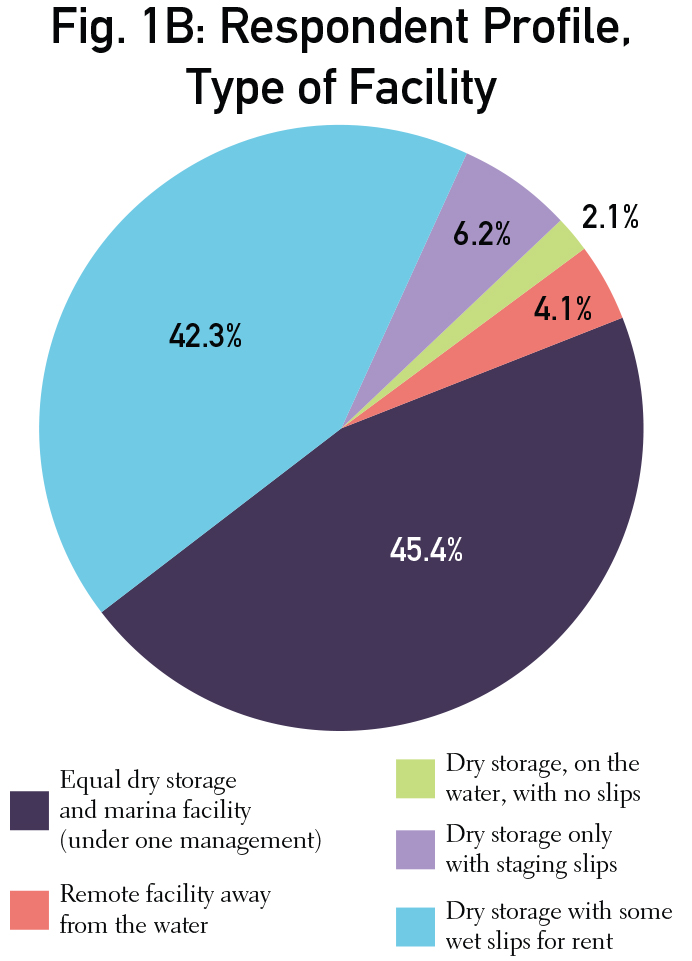
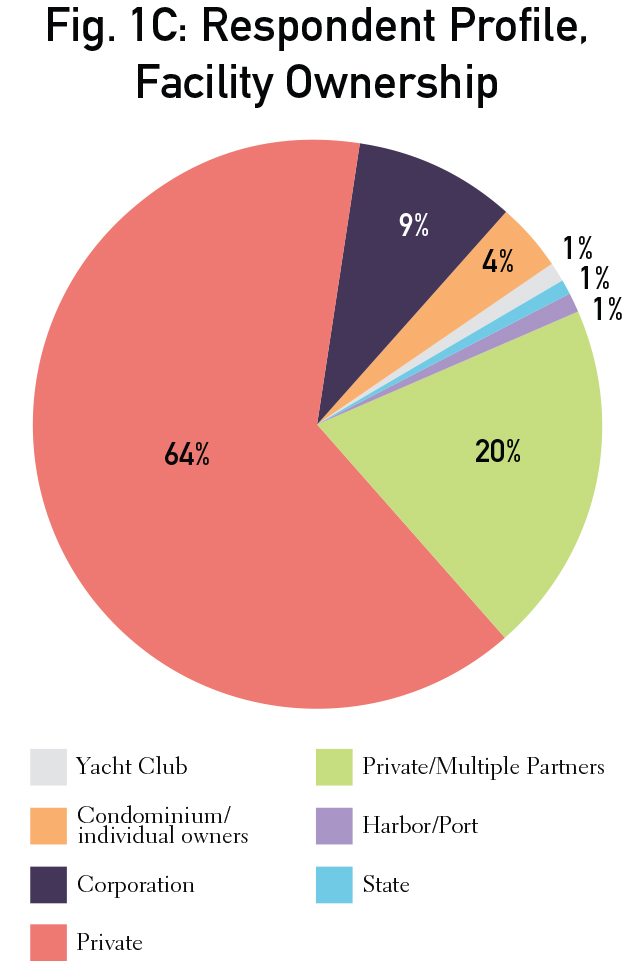
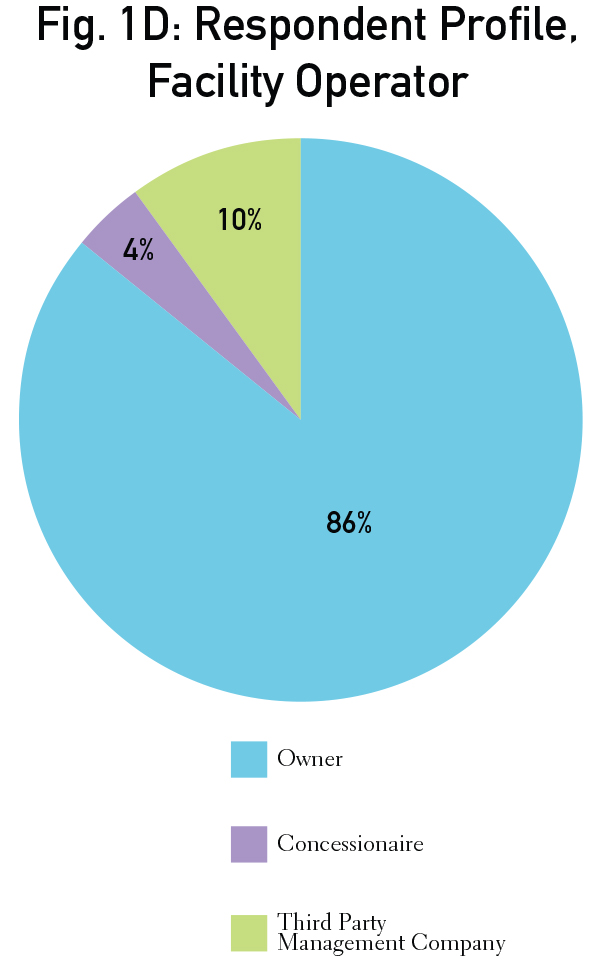
Fig. 1B shows the overall respondents by facility type. The large number of drystacks include both dry and wet slips (45.5%) and dry storage with some wet slips (42.3%). Fig. 1C shows drystacks by type of ownership. The majority are owned by private individual owners (64%) or multiple partners (20%). Fig. 1D identifies facility operators for drystacks. The large majority (86%) are run by owners. Fig. 1E shows drystacks by facility age, which is pretty evenly distributed, young and old. A large number of facilities are more than 40 years old (29%) and 11 to 25 years old (29%).
Infrastructure
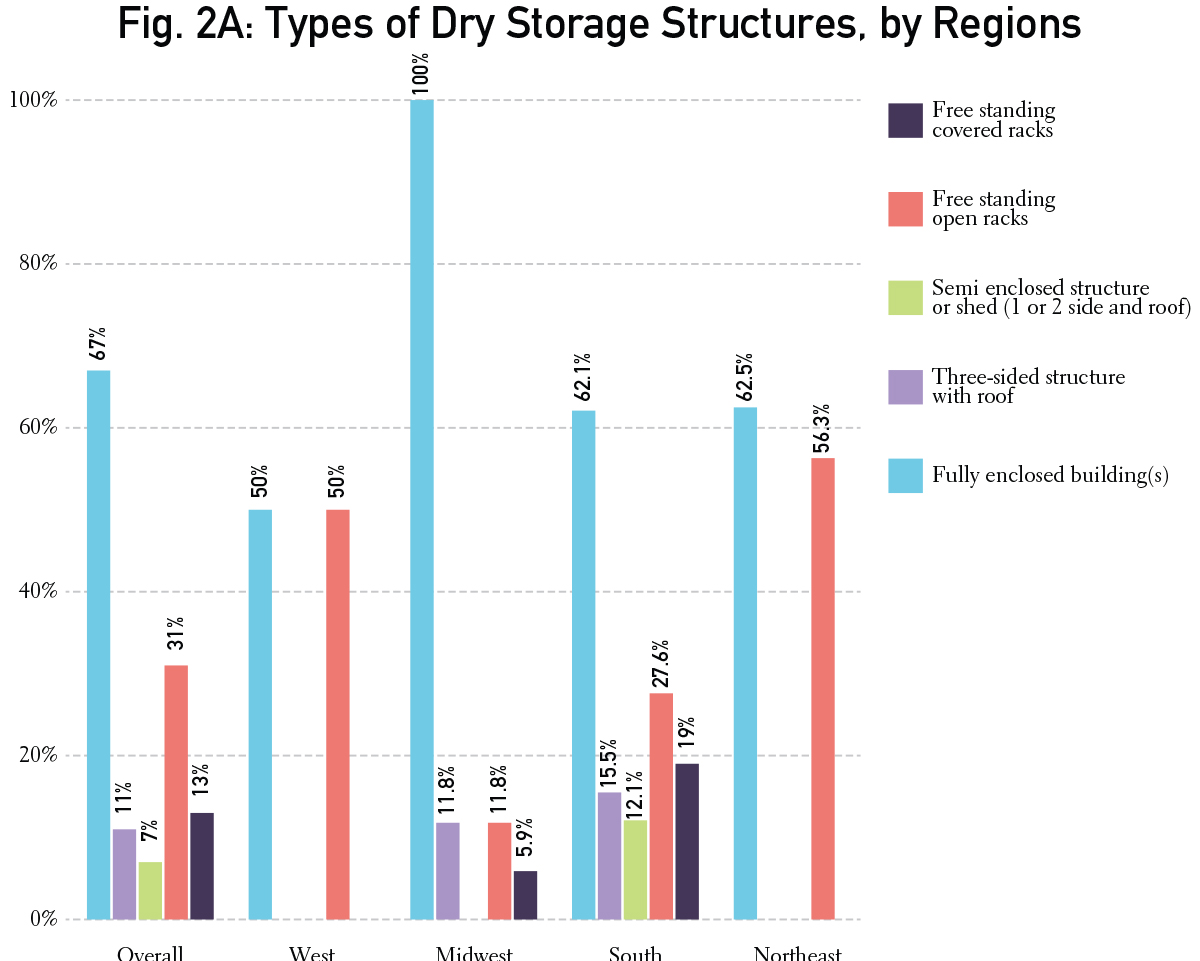
Fig. 2A shows what type of dry storage structures facilities operate by regions. The majority in each region have full enclosed drystack buildings (67%). The South and Midwest use some three-sided structures and free standing covered racks, while the West and Northeast only use buildings and free standing open racks.
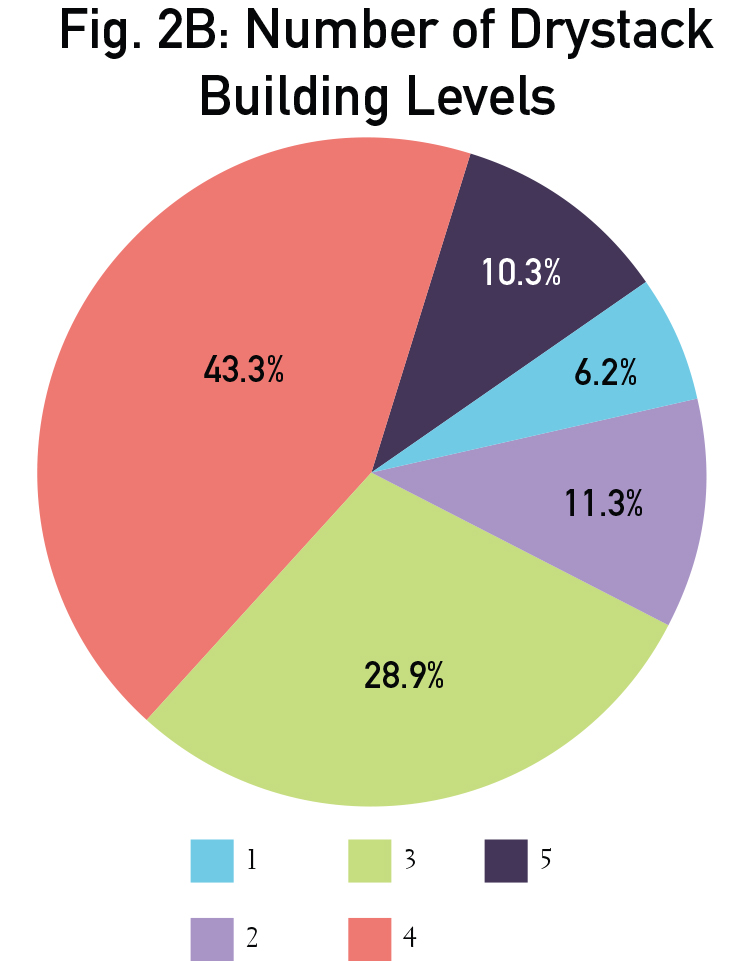
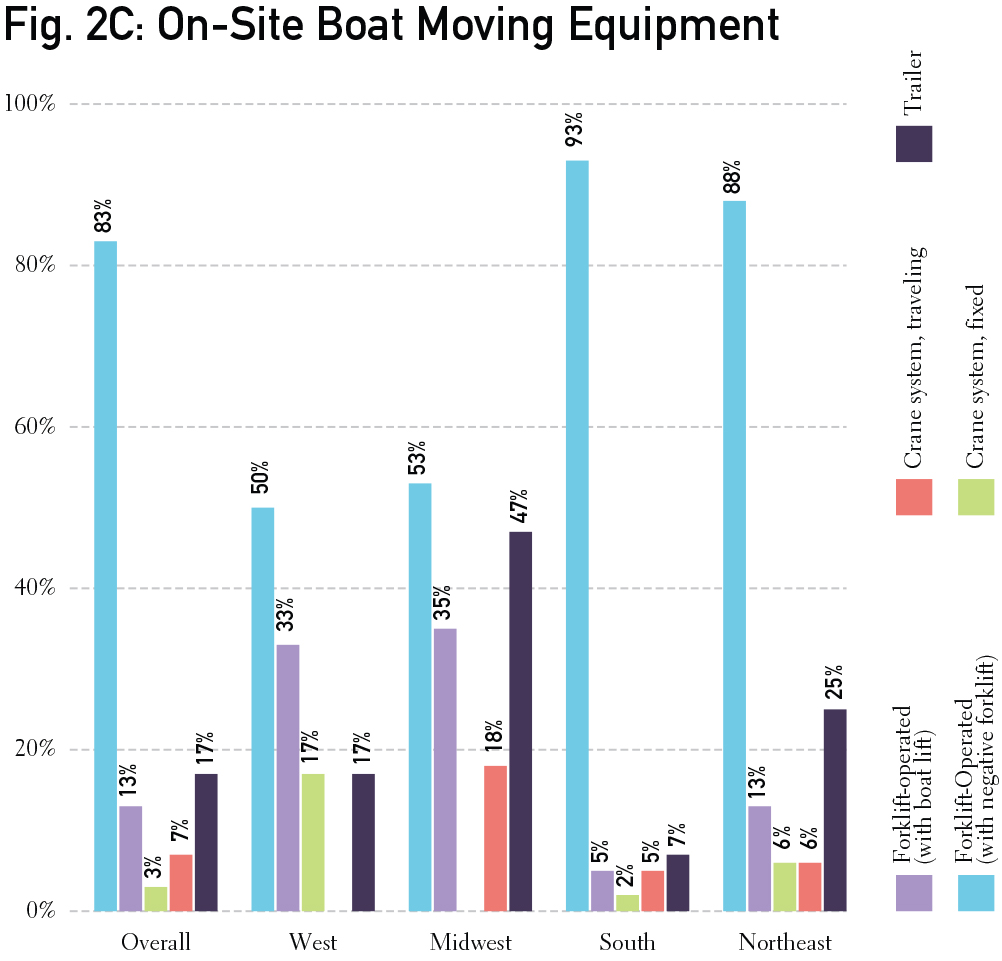
Fig. 2B identifies how many levels drystack buildings support. The majority (43.3%) are four levels high or three (28.9%). Fig. 2C shows what boat moving equipment drystacks use. The majority (83%) use forklifts with negative lift. Facilities in the Midwest, South and Northeast all have some facilities that use traveling crane systems, but the West does not. The West, South and Northeast use fixed crane systems, but the Midwest does not.
Operations
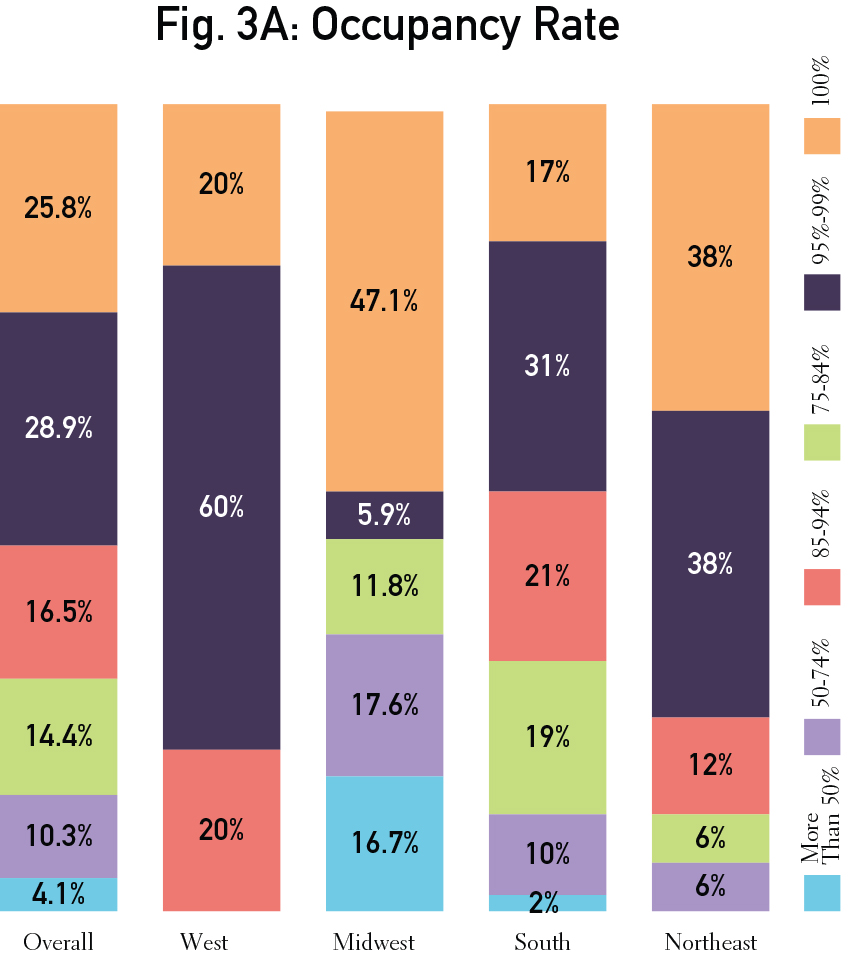
Fig. 3A shows the occupancy rates for drystacks. The majority (71.2%) have an occupancy rate of 85 percent of higher. The Midwest has the largest number of facilities with 100 percent occupancy, and the Northeast also has many facilities at 100 percent.
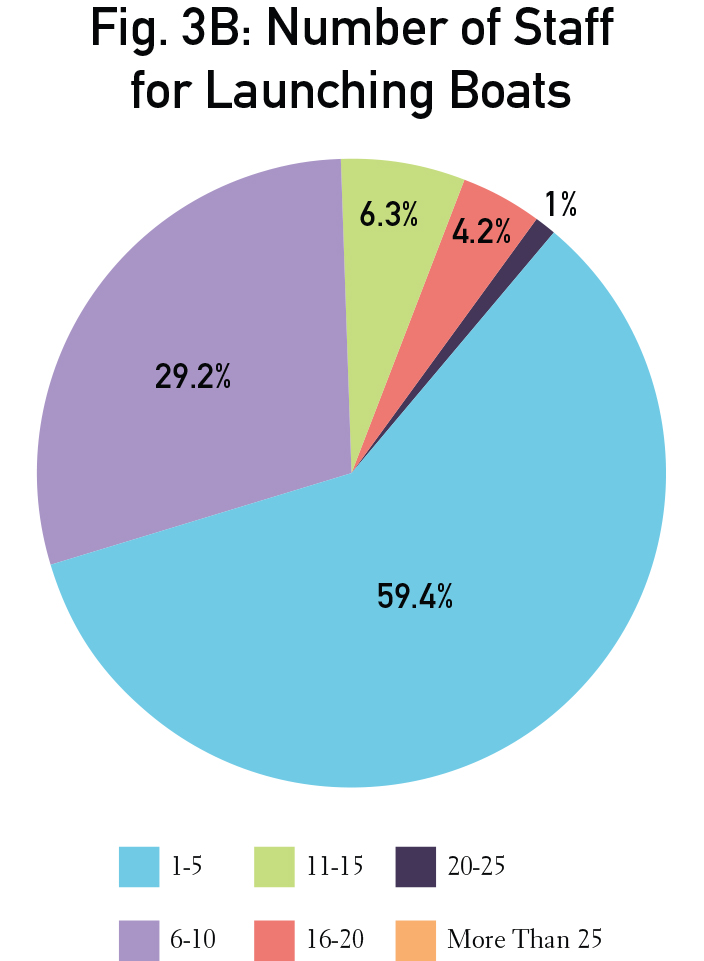
Fig. 3B identifies the number of employees dedicated to launching boats. The majority (59.4%) have 1 to 5 employees, and 29.2% of drystacks have 6 to 10 employees launching boats.
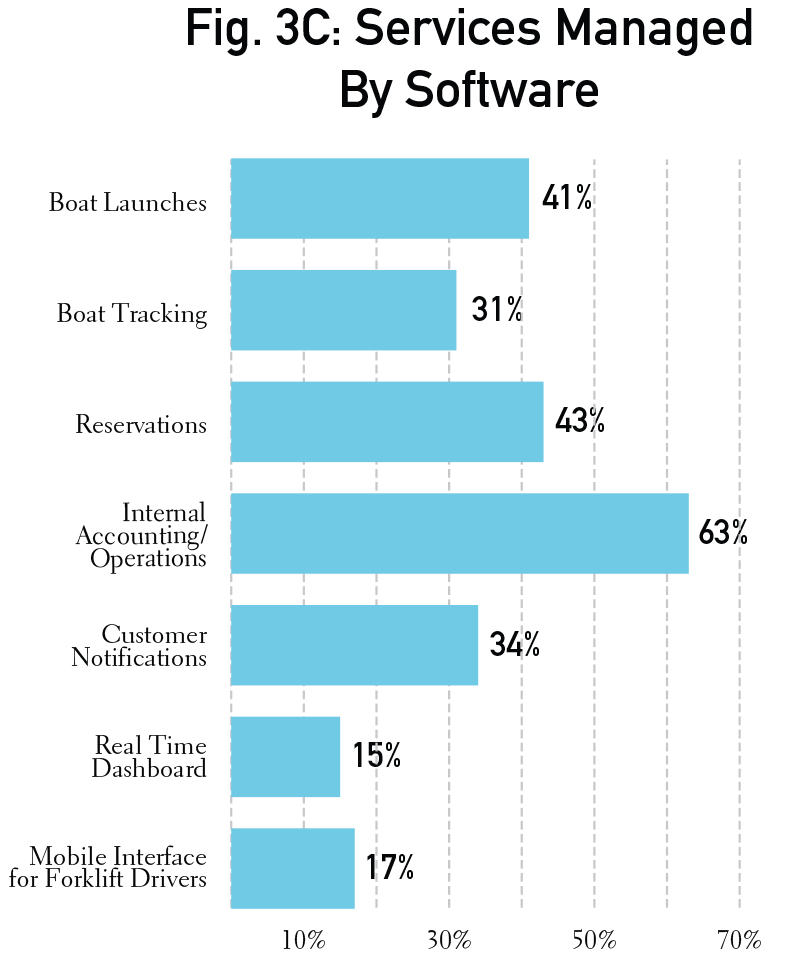
Fig. 3C shows for what different services drystacks use software to manage. Overall, the majority of facilities (63%) use software for internal accounting and operations. A little more than 40% of drystacks use software for reservations and launches, and around 30% use it for customer notifications and boat tracking.
Boat Accommodations
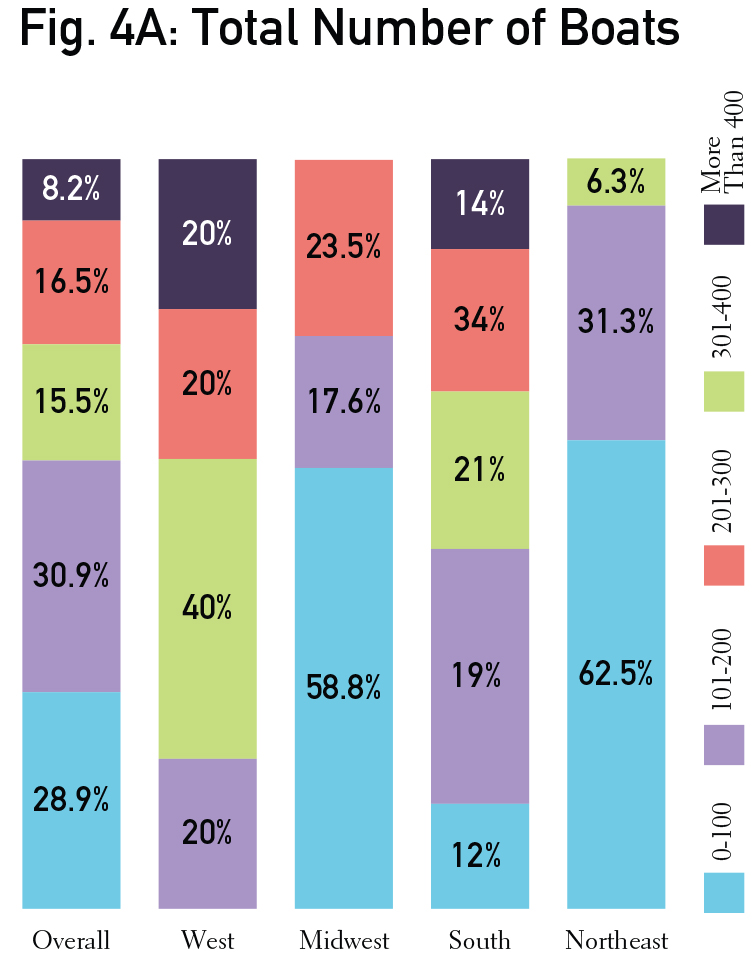
Fig. 4A indicates the total number of boats a drystack can accommodate. Overall, the majority (59.8%) store up to 200 boats. Only 8.2% of facilities can story more than 400 boats. The majority of Midwest and Northeast drystacks store up to 100 boats, and only facilities in the West and South store more than 400 vessels.
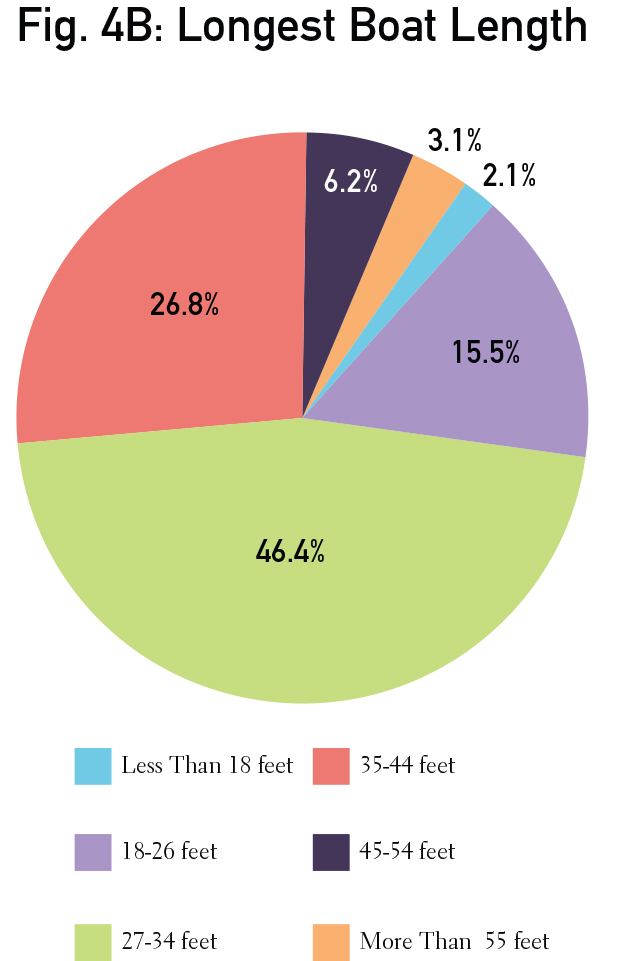
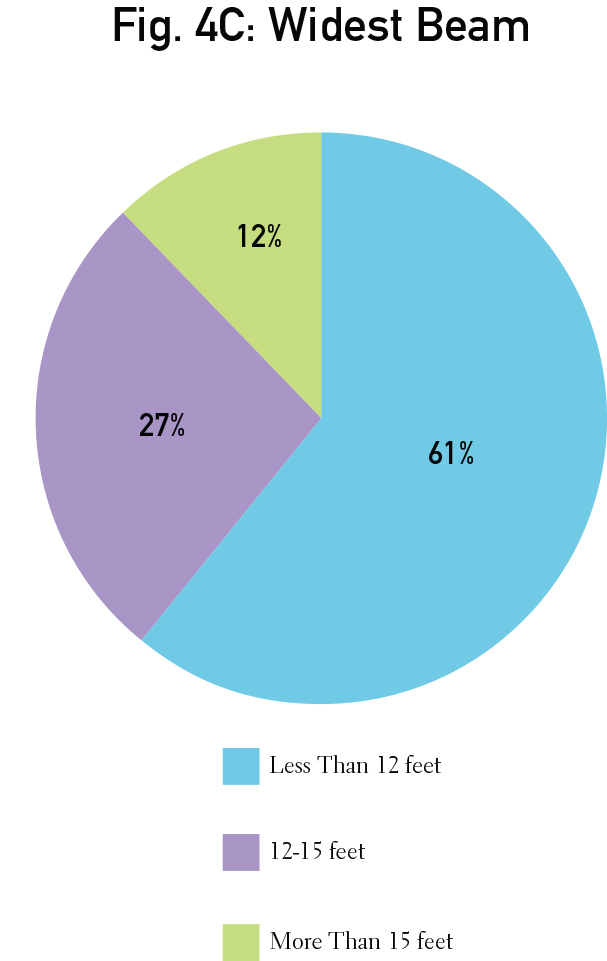
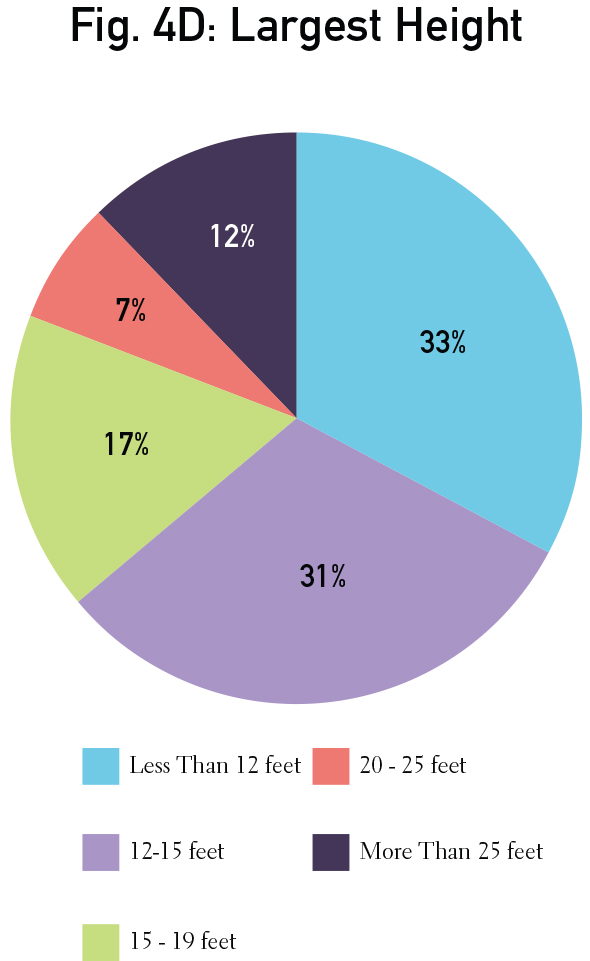
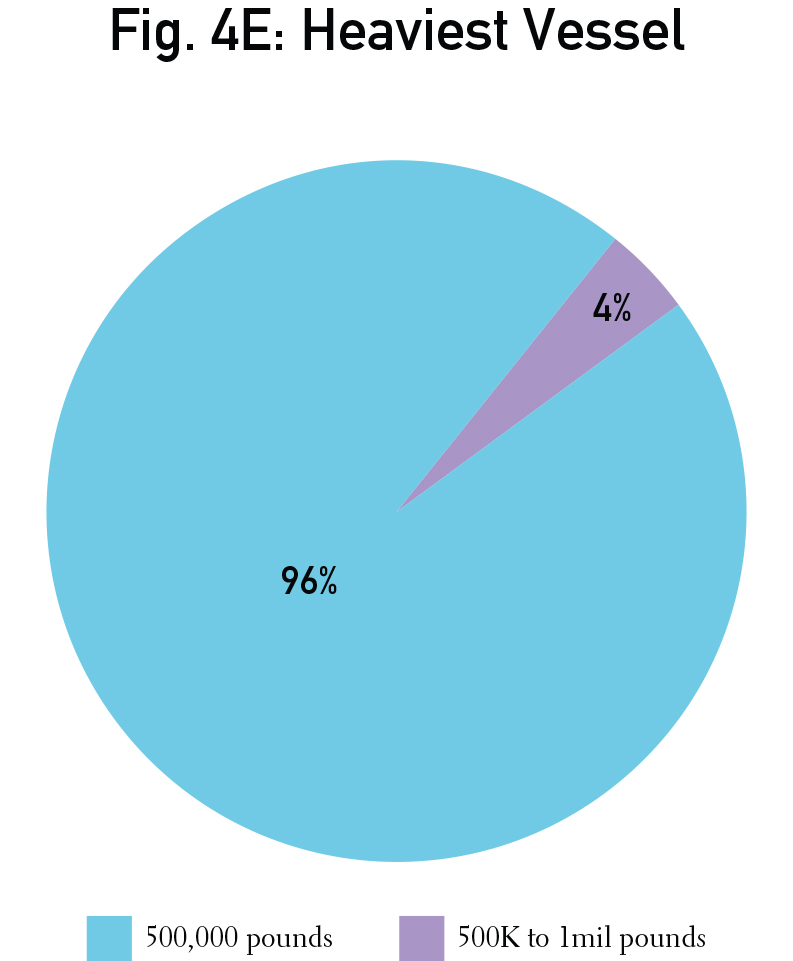
Fig. 4B identifies the longest boat length that drystacks can store. The majority (46.4%) store boats 27 to 34 feet. Fig. 4C shows the largest vessel beam size that a facility can accommodate. The majority (61%) can accommodate vessels that are less than 12 feet wide. Fig. 4C indicates the largest height that drystacks can store. A large number can store vessels more than 25 feet high (33%) and 12 to 15 feet (31%). Fig. 4E shows the heaviest vessel that facilities can accommodate. The majority (96%) can store vessels up to 500,000 pounds.
Boater Services
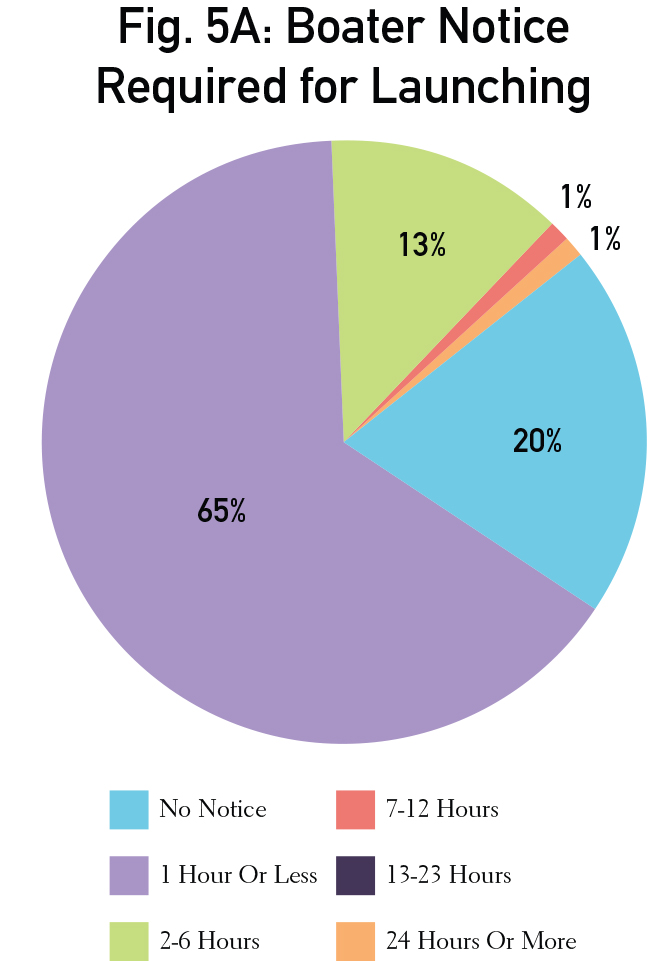
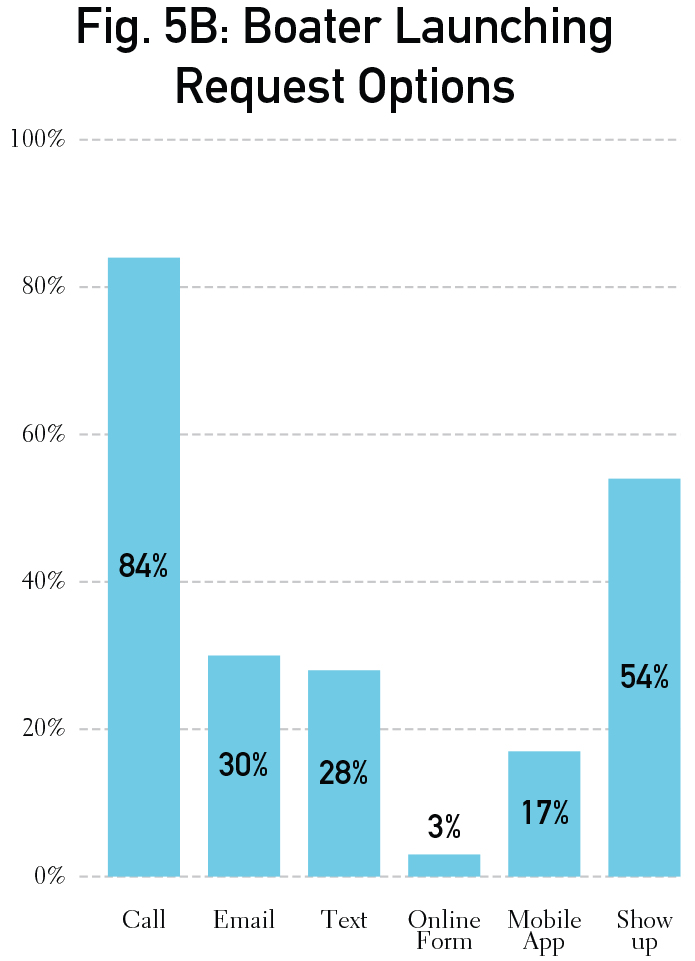
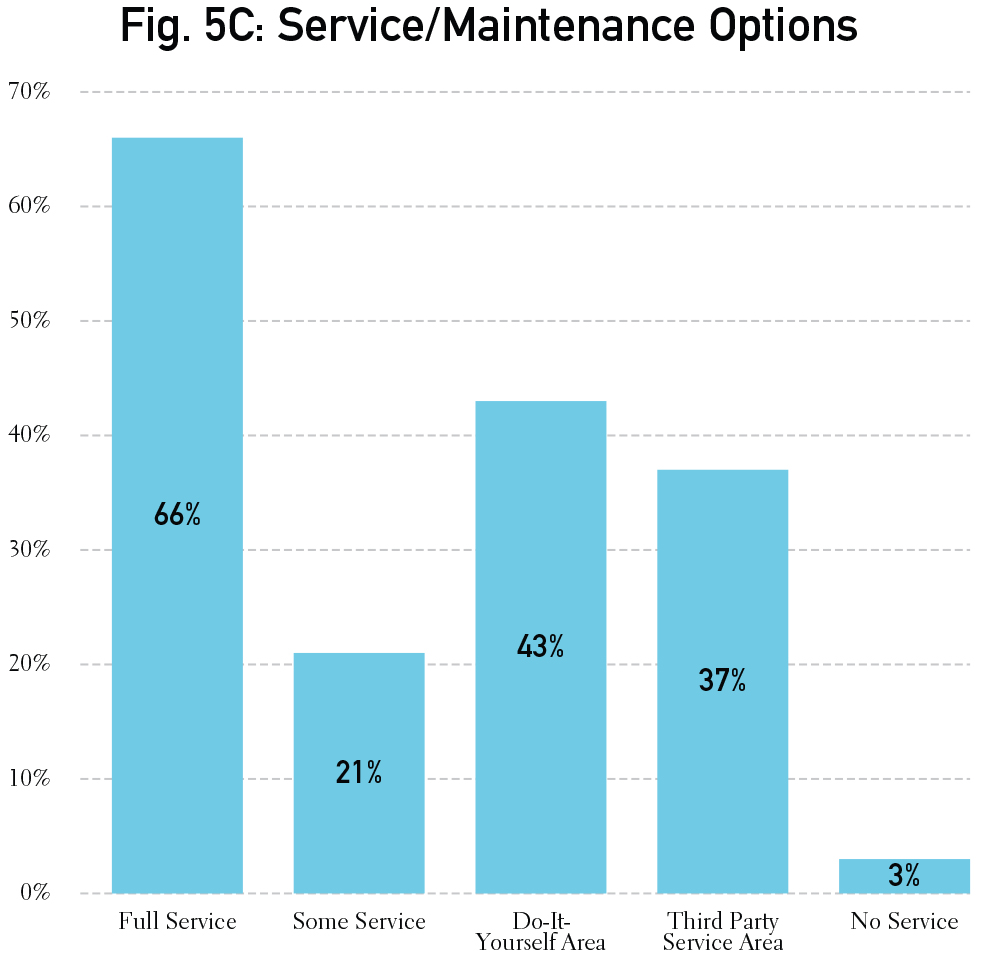
Fig. 5A shows the time that facilities indicated was needed from boaters in order to launch vessels. The majority of facilities (65%) require one hour or less notice. Twenty percent of facilities require no notice for launching. Fig. 5B indicates boater request options for vessel launches. The largest majority of facilities take calls (84%). Many also allow customers to show up with no notice (54%) or email (30%) and text (28%). Fig. 5C shows what type service and maintenance facilities offer on-site. The majority of facilities (66%) offer full-service maintenance. A large number (43%) also have a do-it-yourself area for maintenance.
Customer Launches
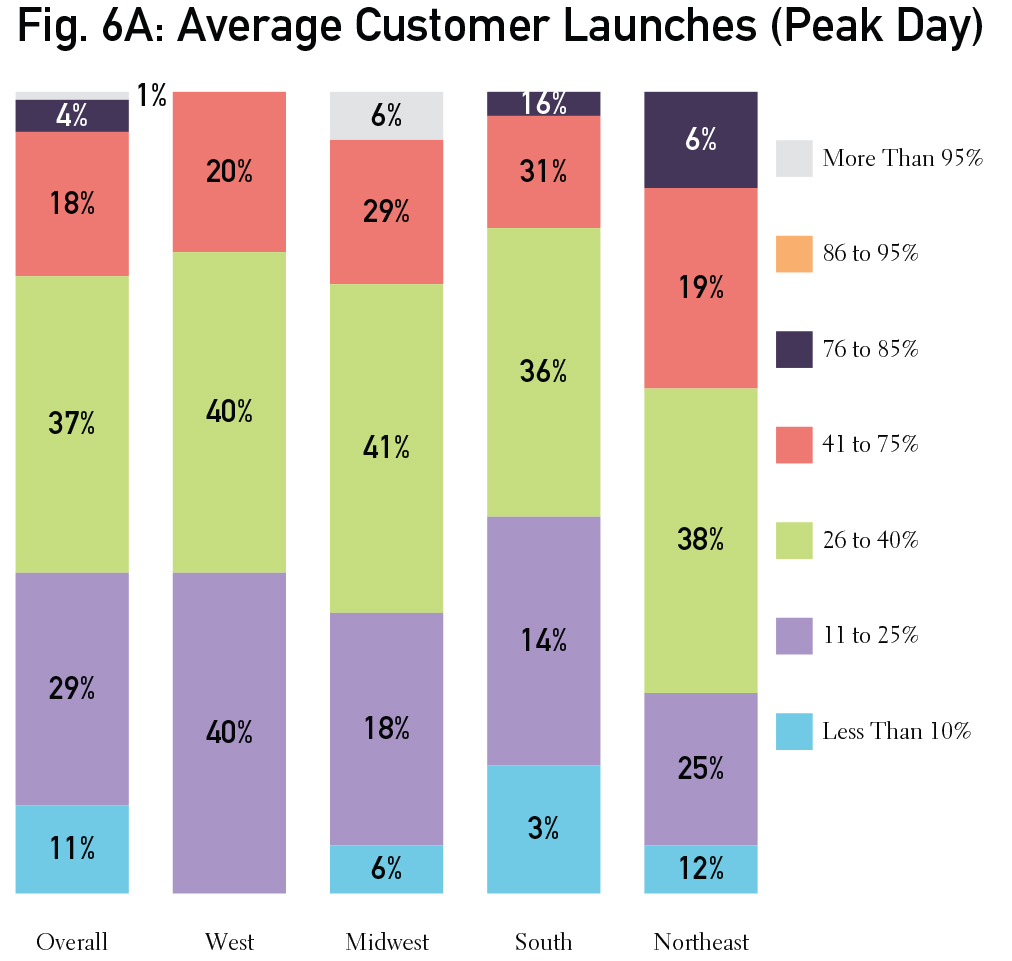
Fig. 6A indicated the average number of customer launches a facility performs on an average day. Overall, the numbers range from more than 95 percent to less than 10 percent. The majority overall (37%) launch 26 to 40 percent of vessels on a peak day. The Midwest was the only region to launch more than 95 percent of facilities, and the West did not have any facilities launching less than 10 percent of vessels on peak days.
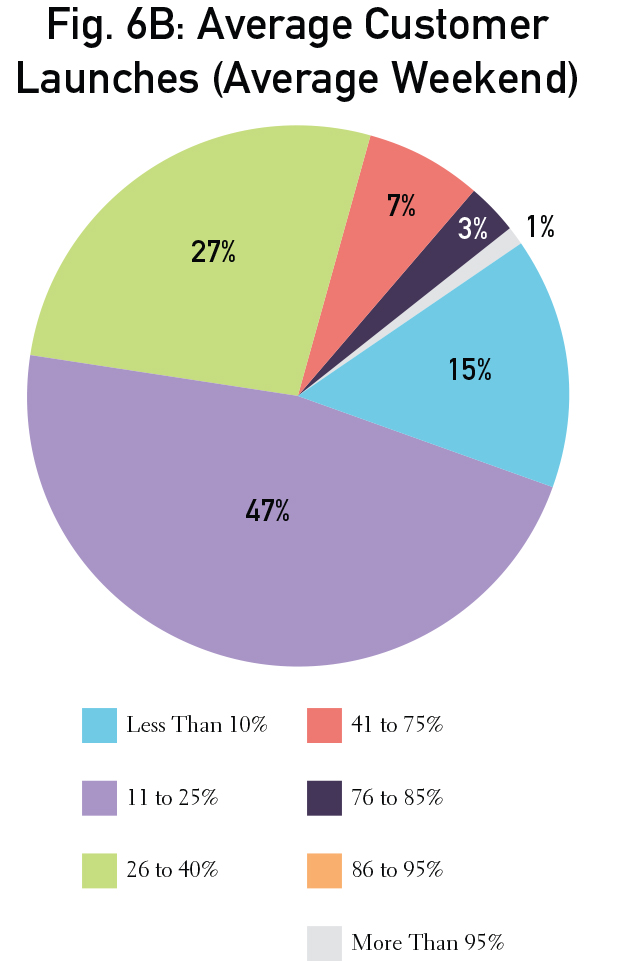
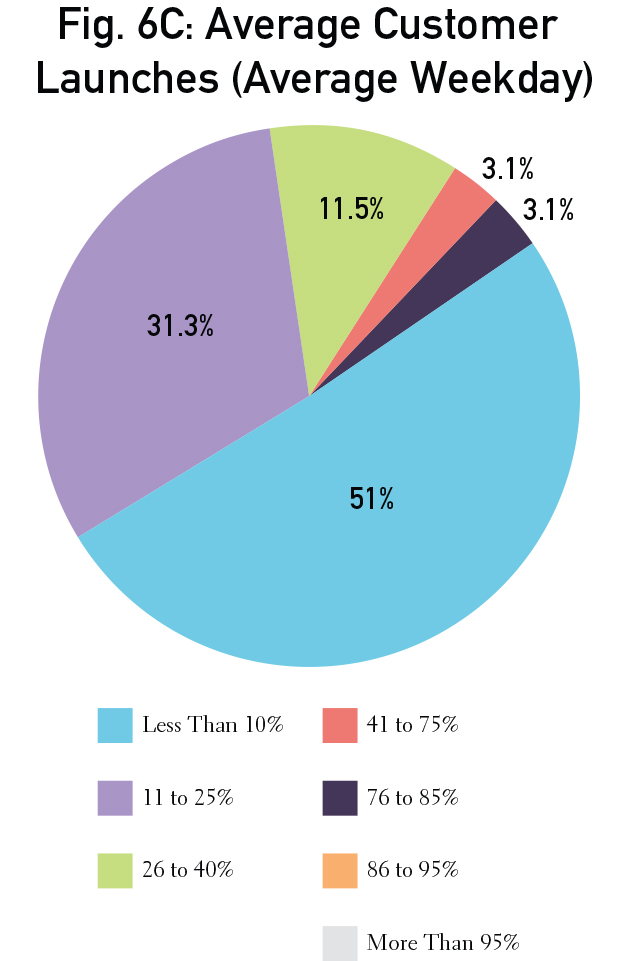
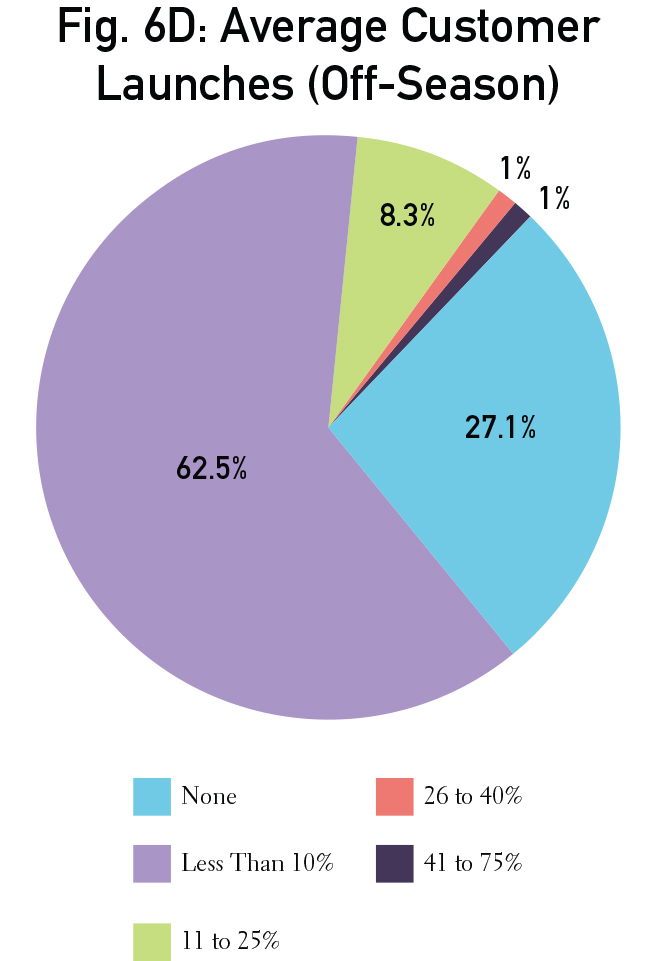
Fig. 6B shows the average number of customer launches on an average weekend. The majority of facilities (47%) launch between 11 to 25 percent of vessels. Fig. 6C indicates the average number of vessel launches on an average weekday. The majority (51%) launch less than 10 percent. Fig. 6D shows the average number of customer launches during the off-season. The majority of facilities (62.5%) launch less than 10 percent of vessels, and a large number (27.1%) do not launch at all during the off-season.
| Categories | |
| Tags |


