Marinas Report on Employee Wages for 2017
Published on December 1, 2017Editor’s Note: This spring, Marina Dock Age magazine partnered with the Association of Marina Industries to distribute the 2017 Wage Rate Survey. It updates the 2014 wage rate survey, looking at wage compensation throughout the industry.
Wage Rate Chart
The chart shows the average years of experience and average hourly wage for general managers, marina managers/harbormasters, dockmasters, yard managers, yard hand, forklift operators and dockhands in each region.
| East Coast | West Coast | Great Lakes | Inland-East | Inland-Central | Inland-West | |
|---|---|---|---|---|---|---|
General Manager | ||||||
| Average Years Experience | 20.8 | 26.3 | 21.3 | 19.3 | 14.6 | 15 |
| Average Annual Wage | $87,441 | $90,046 | $64,625 | $72,111 | $74,707 | $52,500 |
Marina Manager Harbormaster | ||||||
| Average Years Experience | 20.6 | 17.5 | 19.3 | 9.8 | 14.5 | 15 |
| Average Annual Wage | $61,912 | $63,875 | $52,680 | $41,400 | $55,471 | $43,000 |
Dockmaster | ||||||
| Average Years Experience | 7 | 8 | 15 | 32 | 16.5 | 8 |
| Average Annual Wage | $42,192 | $44,633 | $34,000 | $46,600 | $42,357 | $21,000 |
Yard Manager | ||||||
| Average Years Experience | 25 | 15 | 13.5 | 14.5 | 14.5 | 15 |
| Average Annual Wage | $50,384 | $52,999 | $45,987 | $39,200 | $54,763 | $31,500 |
Yard Hand | ||||||
| Average Years Experience | 9 | 10 | 9 | 2 | 9 | 9 |
| Average Hourly Wage | $16.50 | $16.75 | $16.25 | $11.00 | $19.50 | $11.50 |
Forklift Operator | ||||||
| Average Years Experience | 9.5 | 11 | 5 | 17 | 3.5 | 9 |
| Average Hourly Wage | $13.25 | $25.00 | $15.00 | $16.00 | $19.00 | $12.50 |
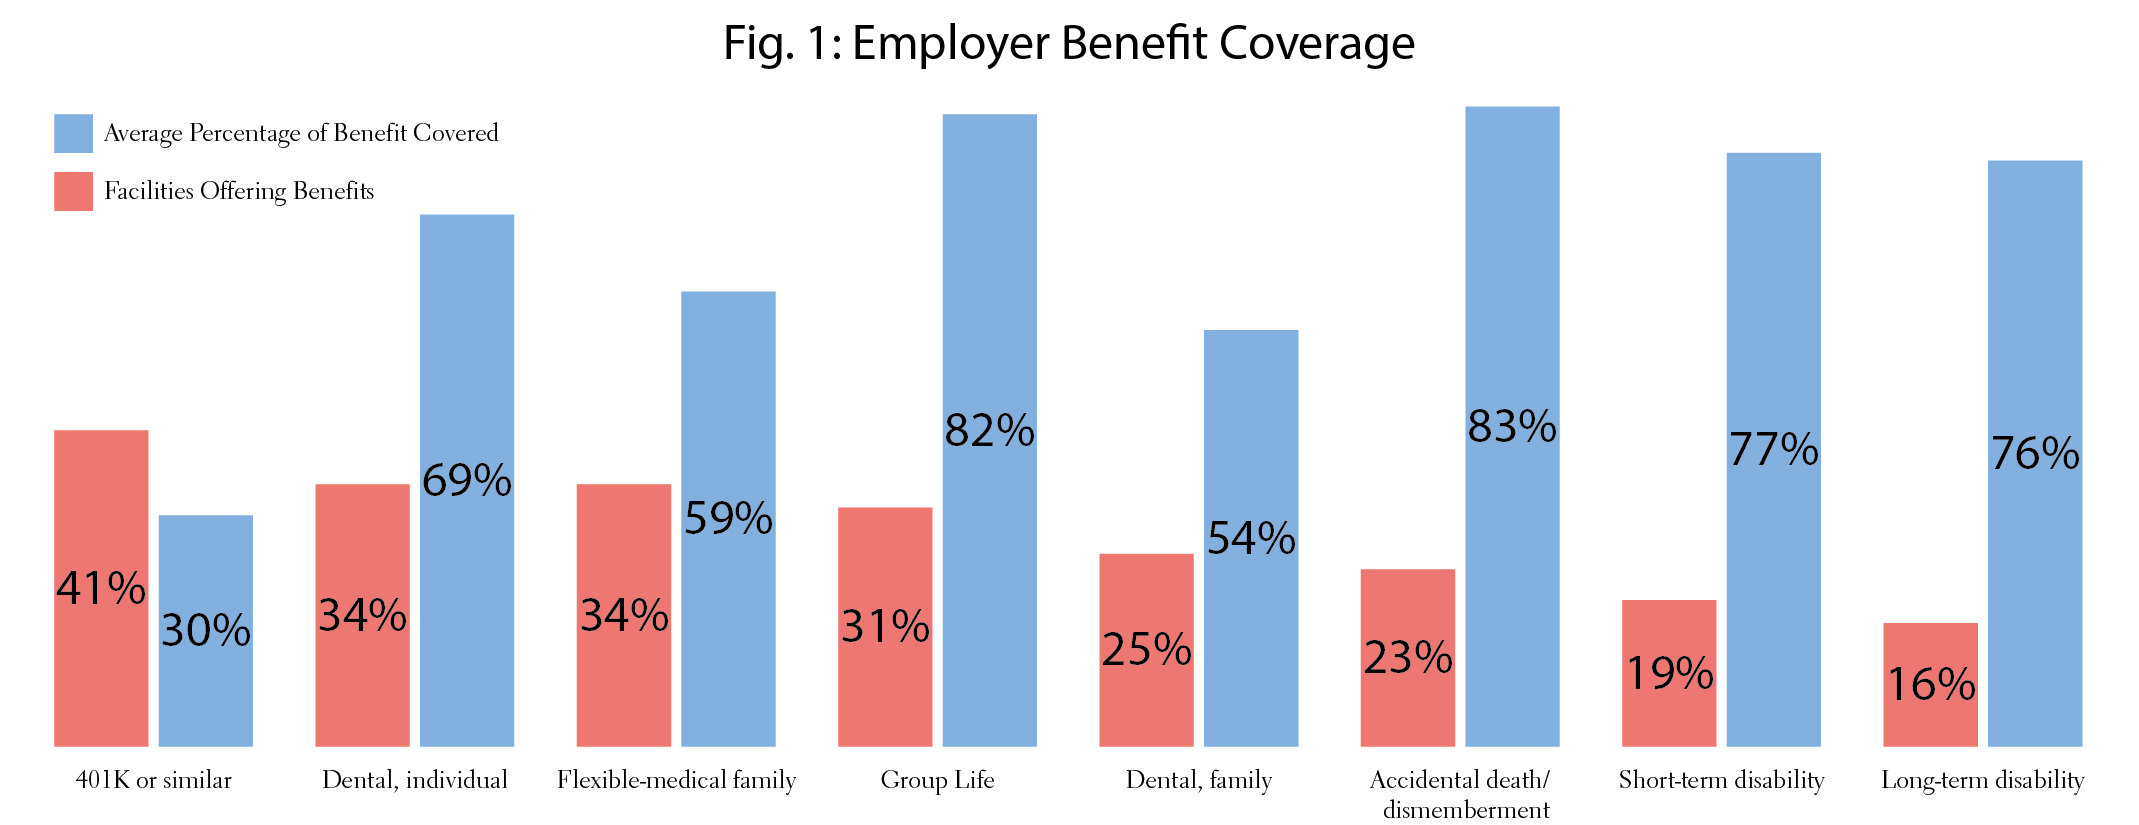
Figure 1
Fig. 1 shows the benefits offered by employers – the percentage that offers each benefit, and the average percentage covered by employers.

Sign up for the Marina Dock Age newsletter.Our newsletter delivers the latest news straight to your inbox including breaking news, our exclusive content covering the marina and boatyard industry, new products, and much more.
| Categories | |
| Tags |


