Annual Survey Shows the Majority of the Industry with Increased Rates and Gross Profits for 2017
Published on December 1, 2017Editor’s note: Marinas and boatyards across the country answered questions about their occupancy rates, revenues, expenses, gross profits and more. A selection of the statistics is available here.
Respondent Profile
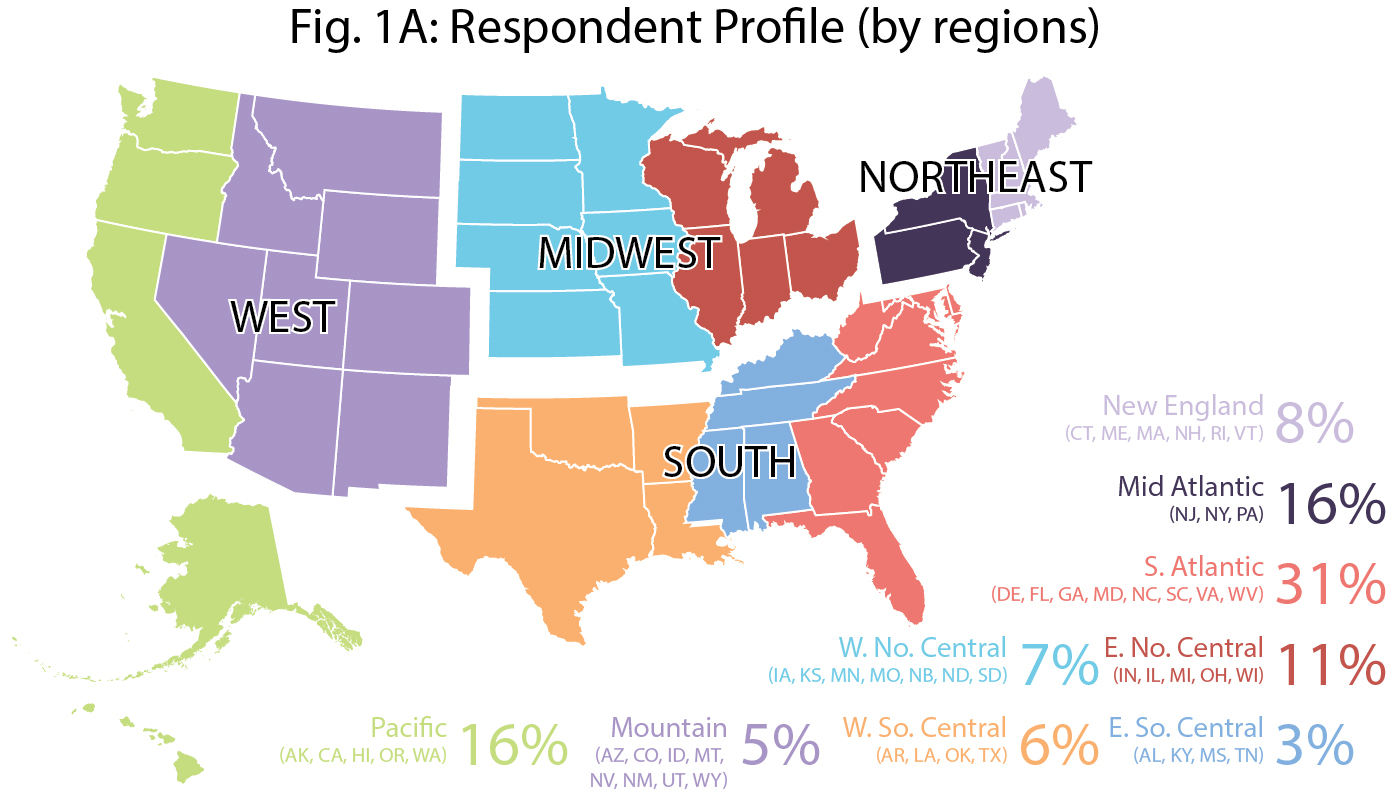
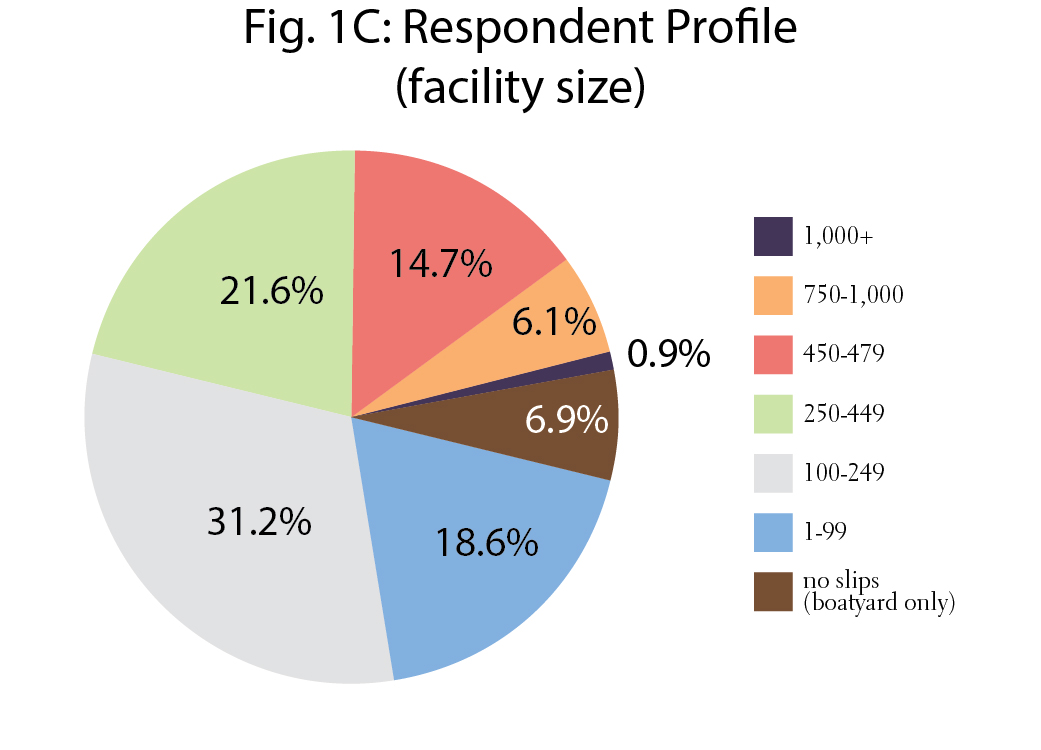
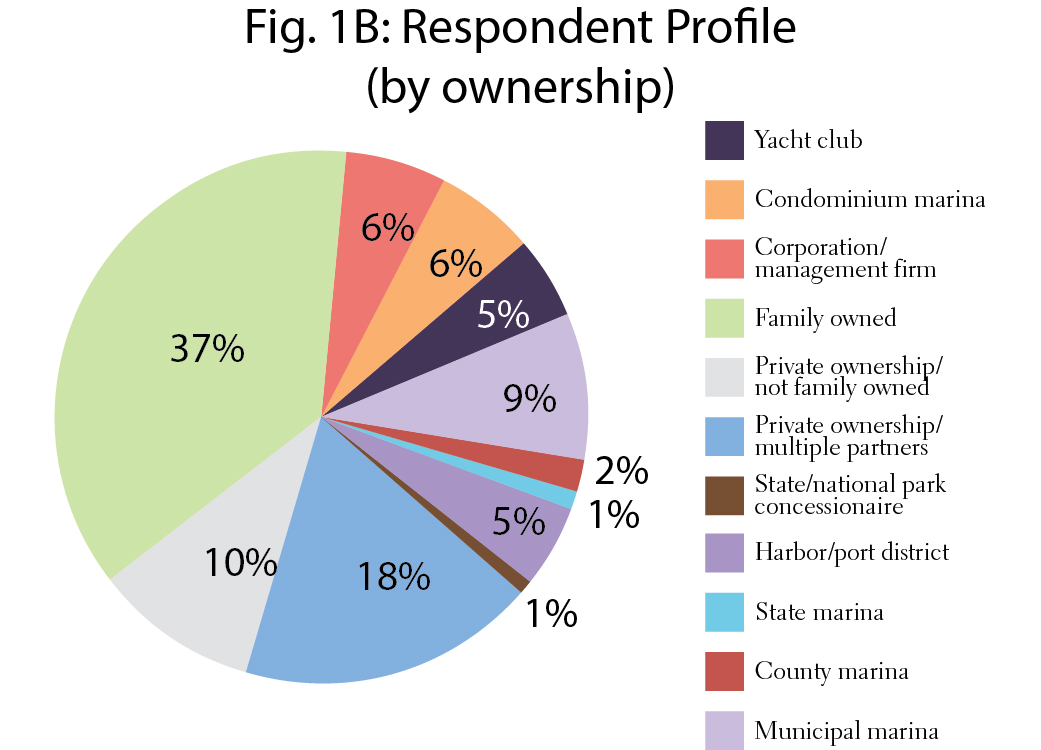
Fig. 1A, 1B and 1C shows the overall respondents to the surveys.
The top states by the number of respondents are Florida (13%); New York (10%); California (9%); Maryland (6%); Washington (5%). The survey did not have respondents from Alabama, Arizona, Arkansas, Colorado, Delaware, D.C., Hawaii, Illinois, Iowa, Mississippi, Montana, Nevada, New Hampshire, North Dakota, Oklahoma, Oregon, West Virginia and Wyoming. See Fig. 1A for a breakdown of the respondents by regions.
The majority of the industry is privately owned facilities (65%) and between 100 and 249 slips (31.2%). See Fig. 1B and 1C.
Occupancy Rate
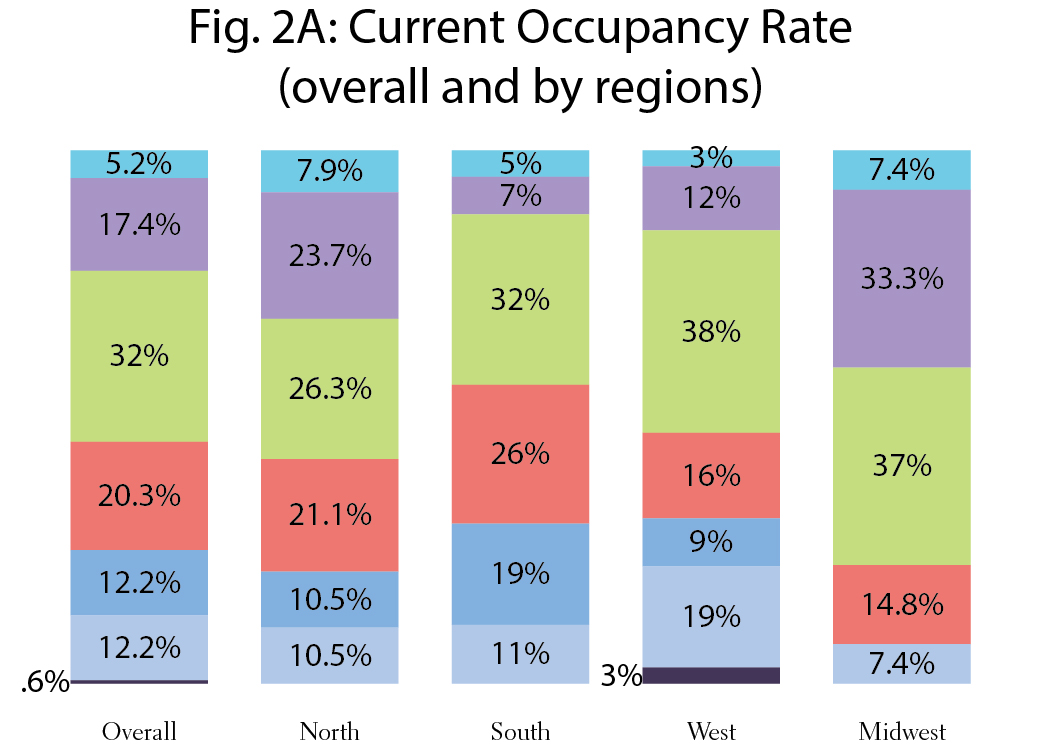
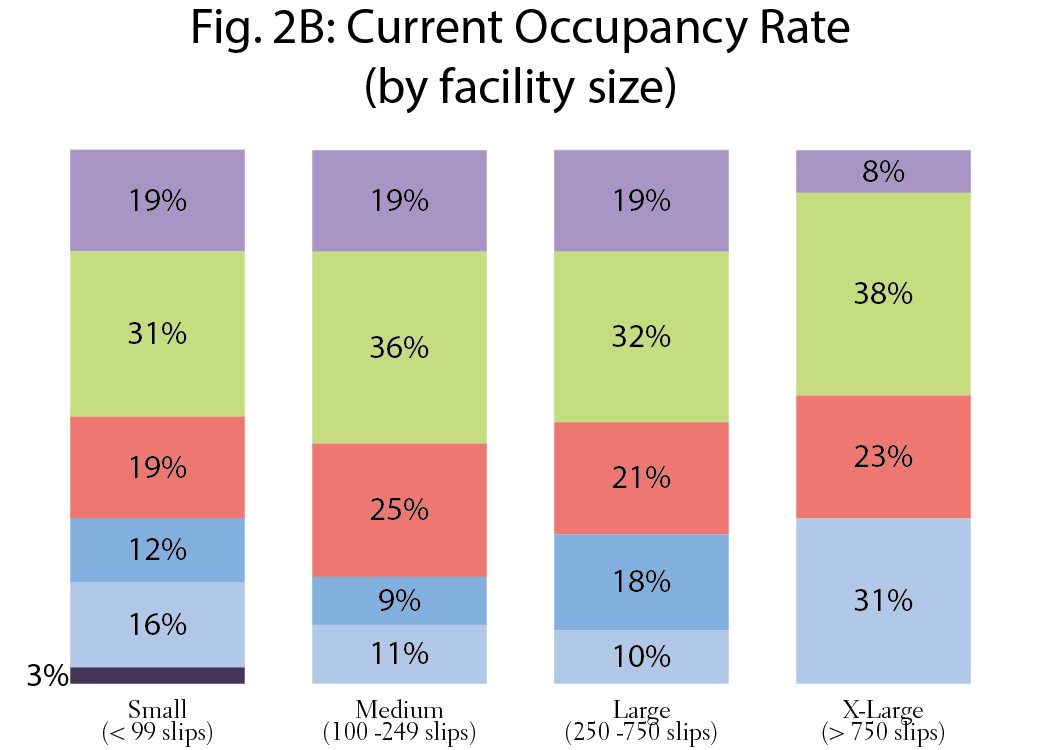
The majority of facilities have an occupancy rate between 95 and 99 percent. A large number of facilities in the Midwest and Northeast have 100 percent occupancy (See Fig. 2A). Occupancy rates were fairly similar, depending on facility size (number of slips). See Fig. 2B.
Product/Service Revenues
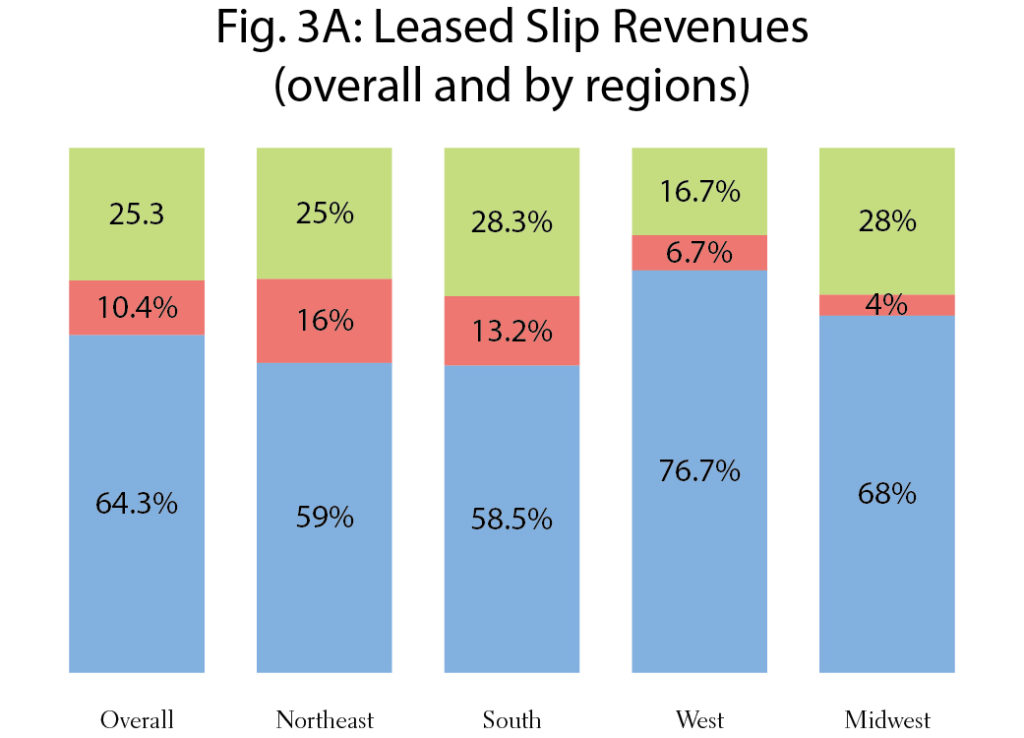
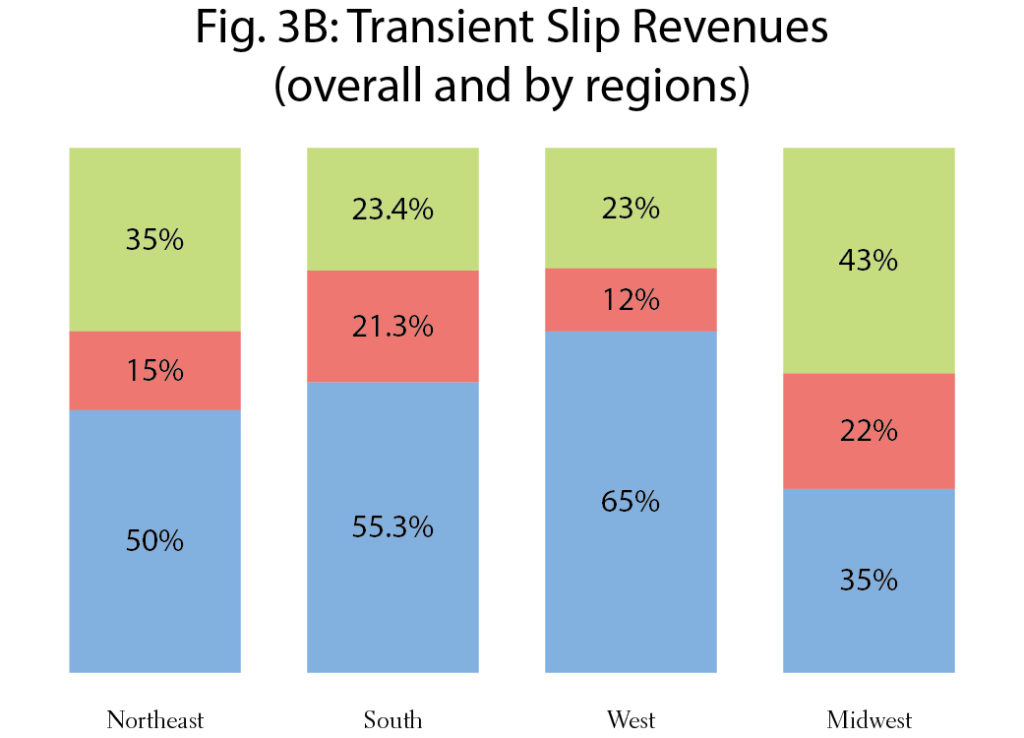
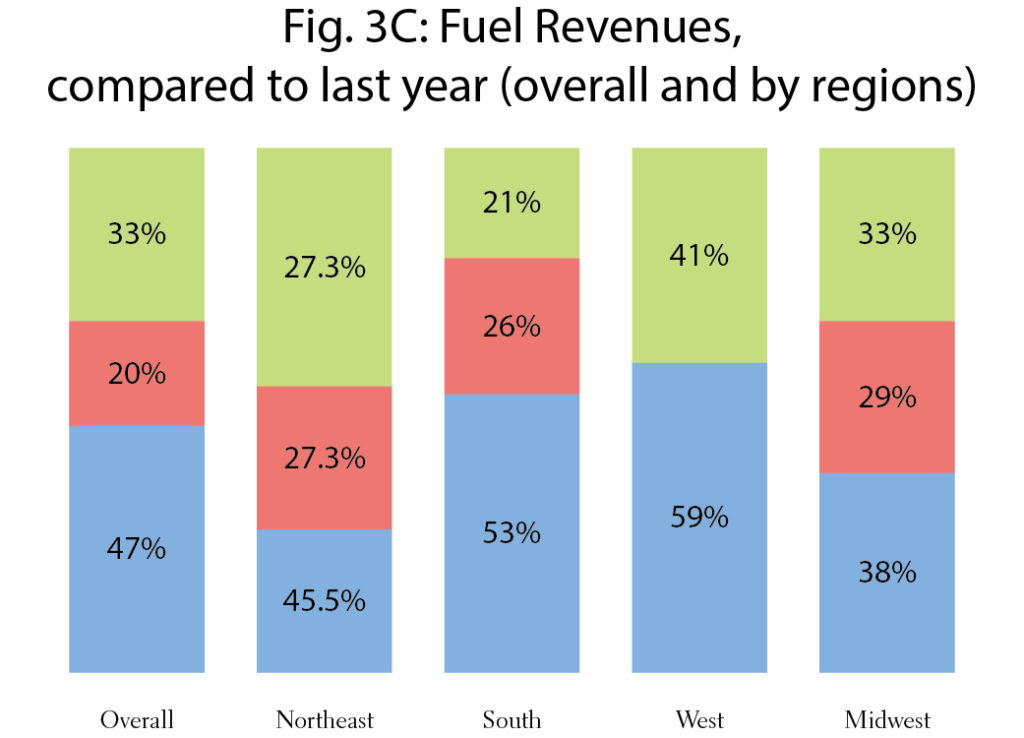
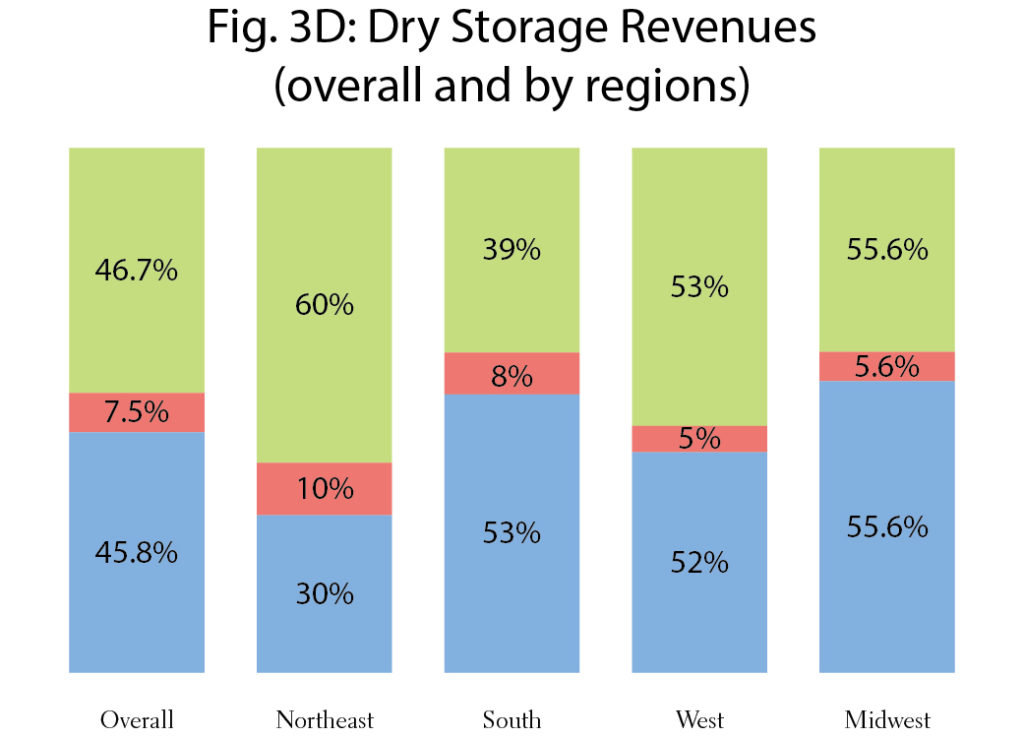
Fig. 3A, B, C and D represents a small selection of the different profit centers offered by marinas and boatyards (leased slips, transient slips, fuel and dry storage).
The West had a larger number of facilities with increased leased slip revenues, compared to the other regions. The Midwest had a lower number with increased transient slip revenues.
Expenses and Slip/Service Rates
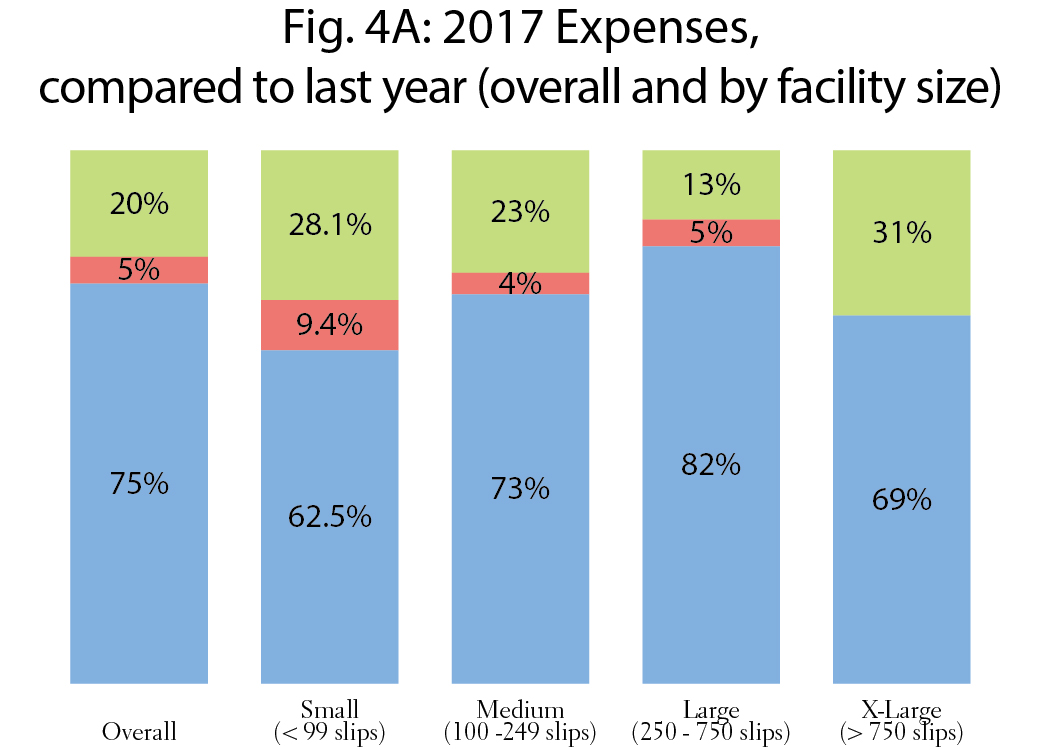
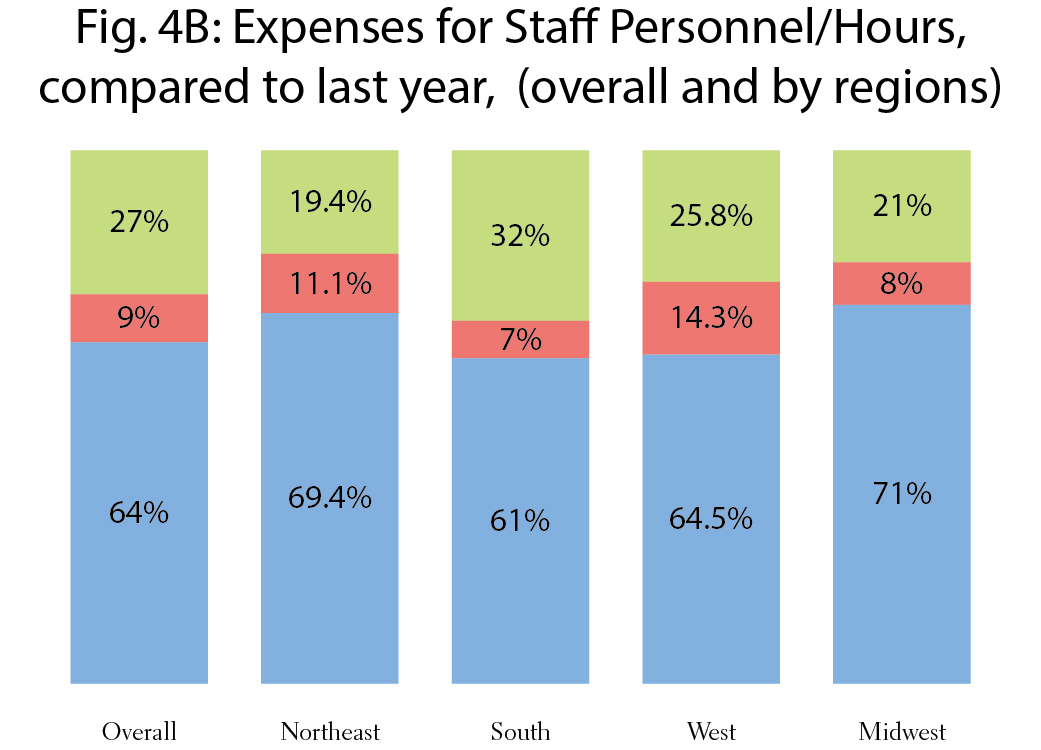
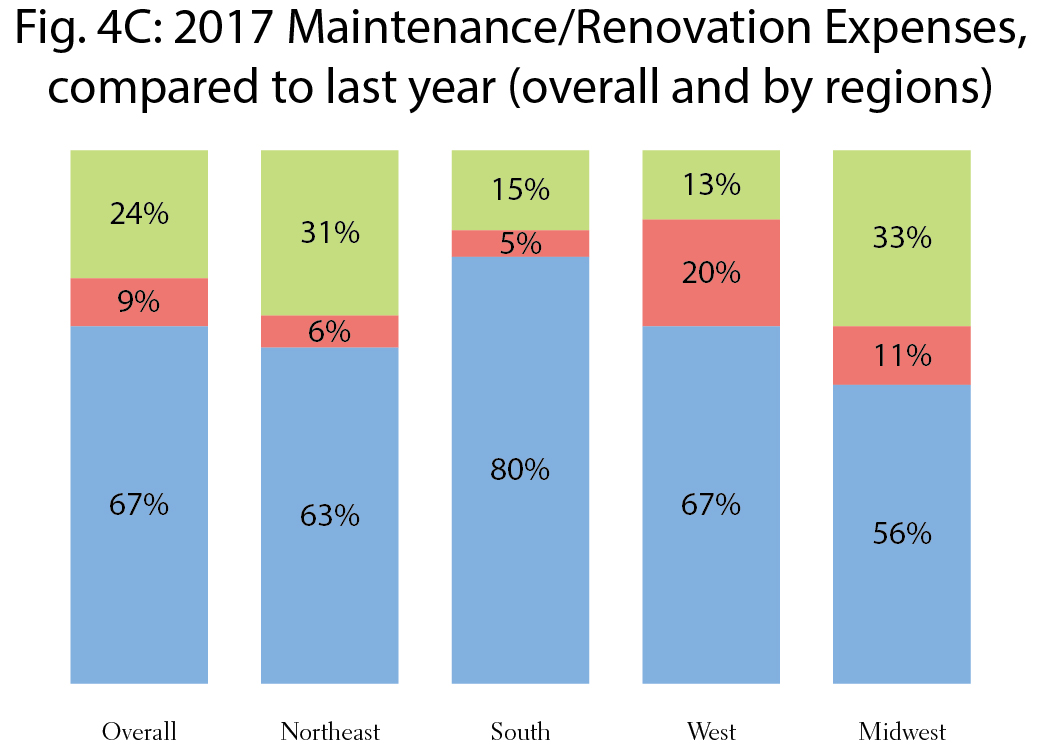
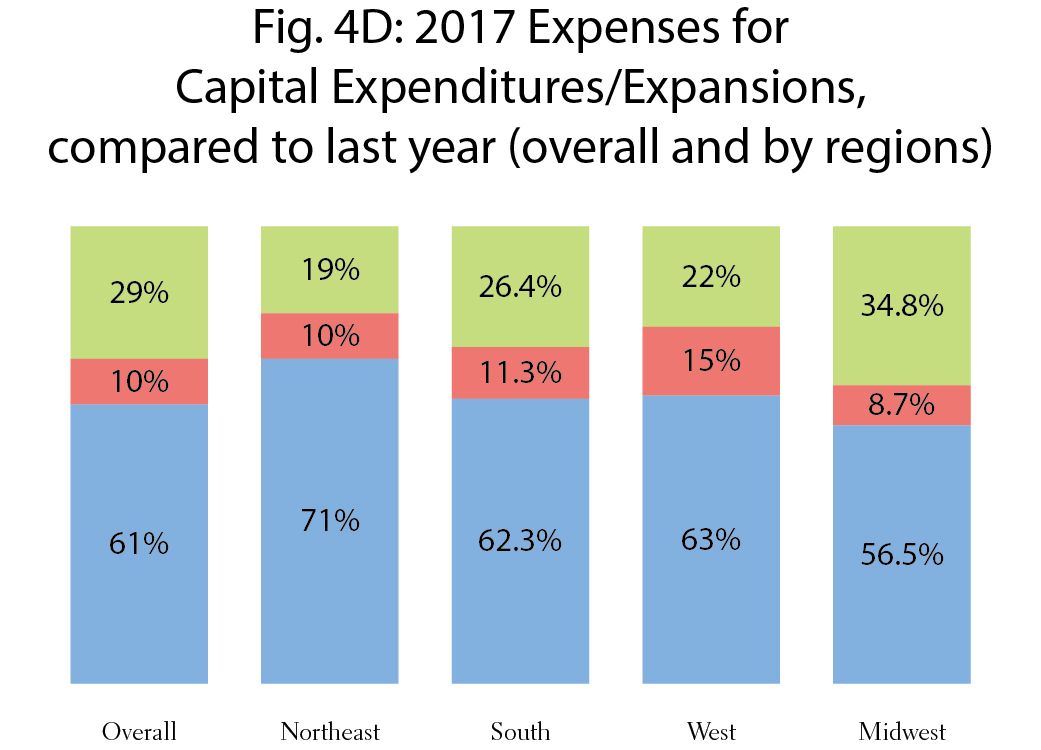
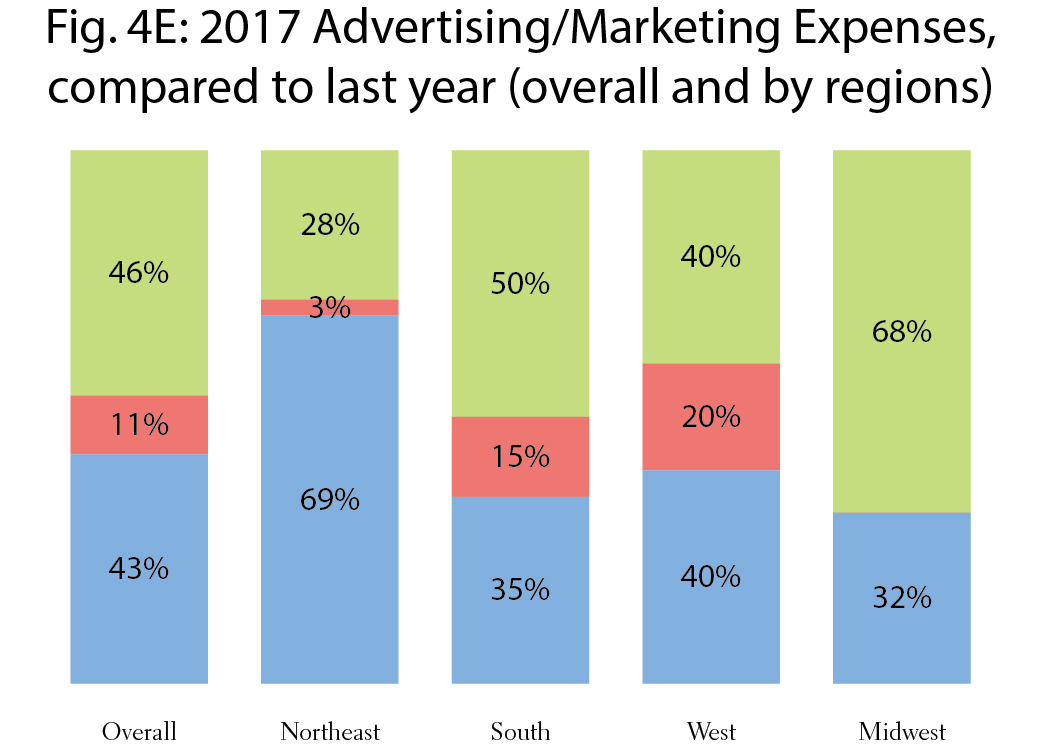
The large majority of facilities have increased expenses for 2017, compared to last year (75%). See Fig. 4A. Fig. 4B, C, D and E represent a selection of individual 2017 expenses, compared to last year (staff personnel, maintenance/renovation, capital expenditures/expansions and advertising/marketing).
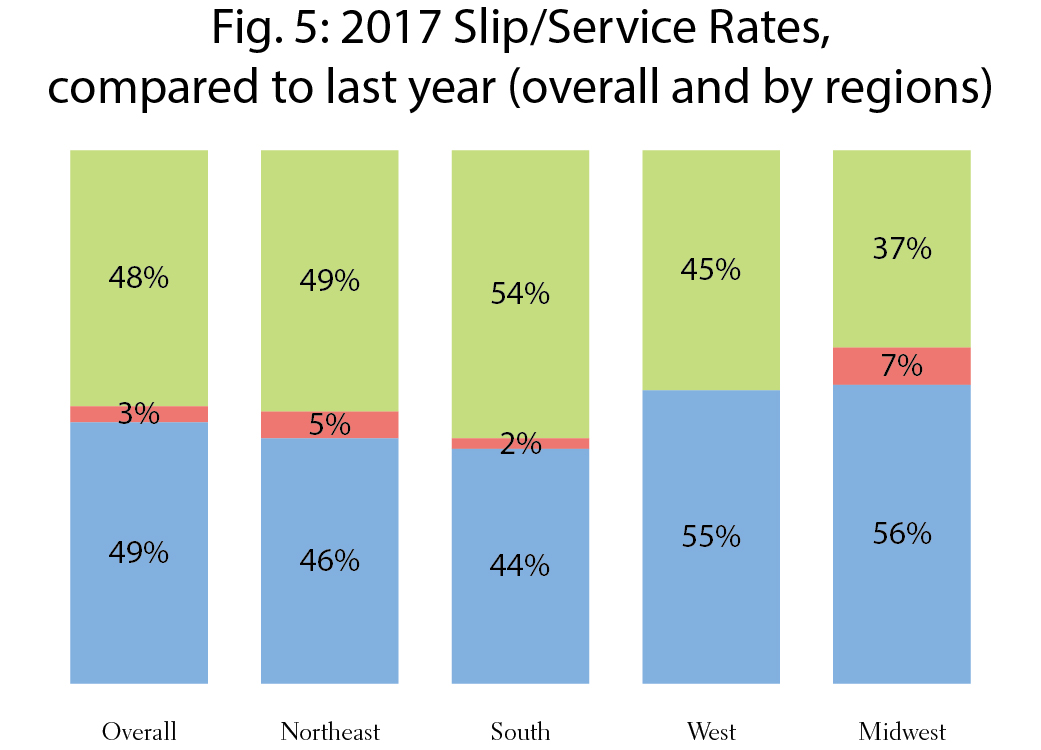
Very few facilities decreased slip or service rates for 2017. See Fig. 5. A slightly larger number of facilities in the West and Midwest increased rates, compared to last year.
Gross Profit
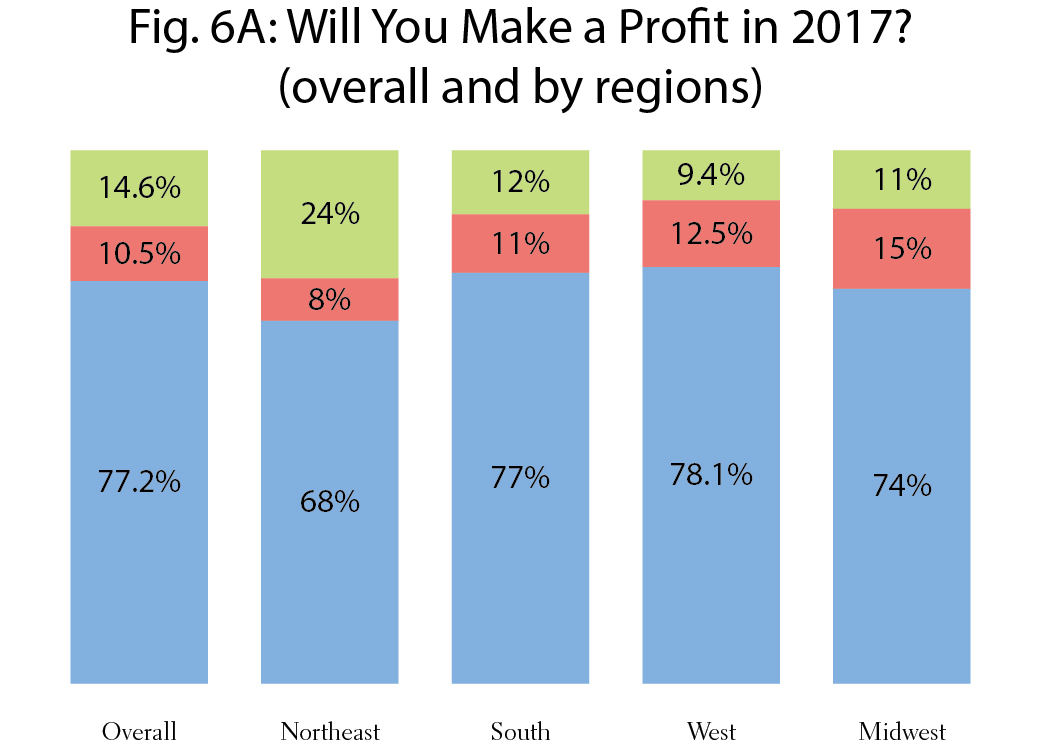
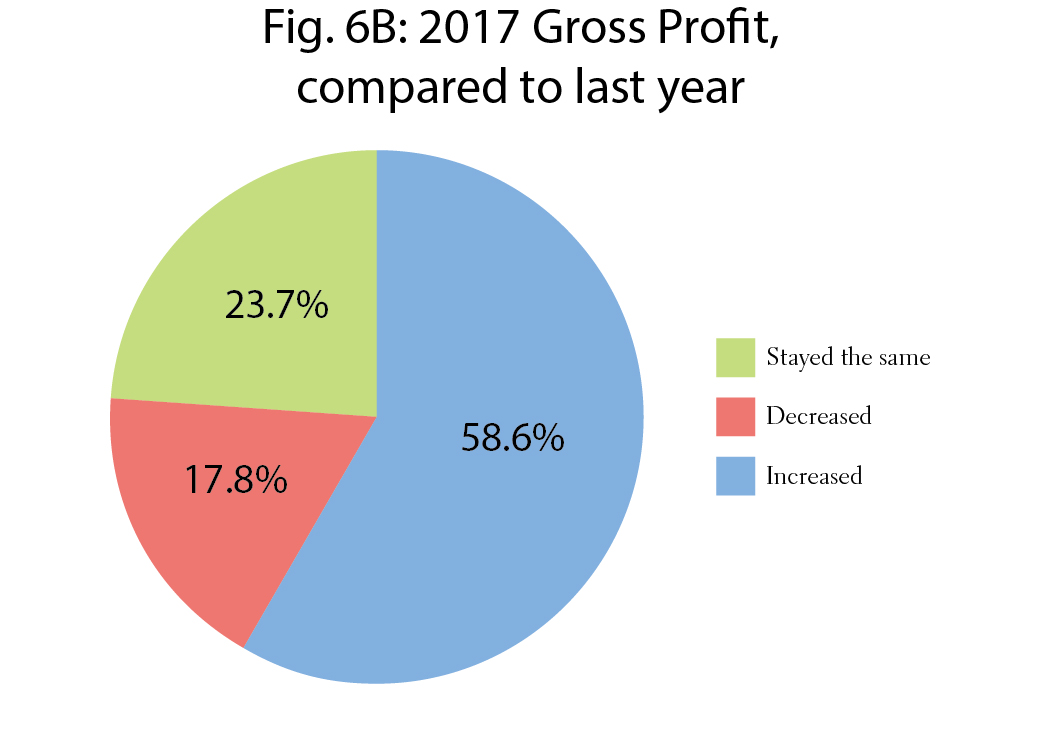
The majority of facilities will make a gross profit in 2017 (77.2%); 10.5% will not make a profit, and almost 15% were not sure. See Fig. 6A. The majority of facilities also had increased profits for 2017, compared to last year (58.6%). See Fig. 6B.
| Categories | |
| Tags |


