Industry Survey Statistics Show Continued Growth in 2017
Published on January 19, 2018Editor’s Note: In October 2017, marinas and boatyards answered this annual industry survey. The results focus on performance statistics, such as occupancy rates, revenue and expense trends and gross profit numbers. For additional survey information and statistics, see the December 2017 issue and the newly updated Marina Dock Age website (www.marinadockage.com).
Respondent Profile
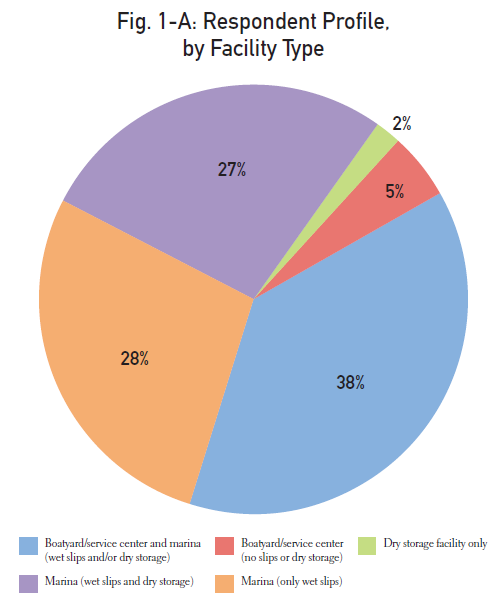
The respondent profile gives an overview of those that answered the survey, and the overall industry. The majority of respondents were facilities that offered wet slips, service and dry storage (38%). A large number were also marinas with wet slips only or wet slips and dry storage. See Fig. 1-A.
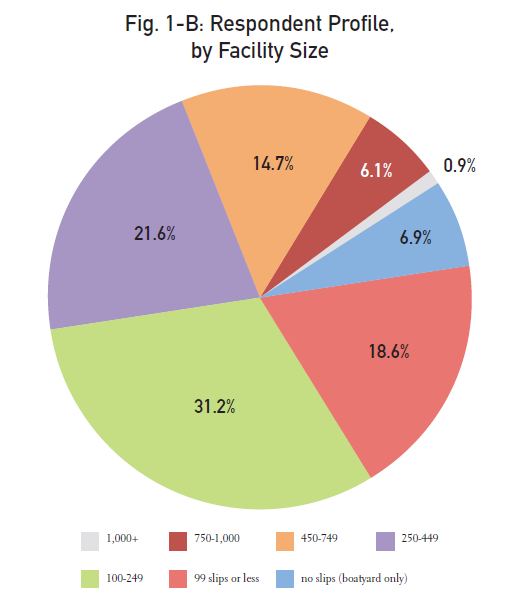
Fig. 1-B shows the respondent profile by facility size. Facilities range from those with less than 100 slips to facilities between 750 to 1,000 slips. A small portion of the respondents were facilities with more than 1,000 slips.
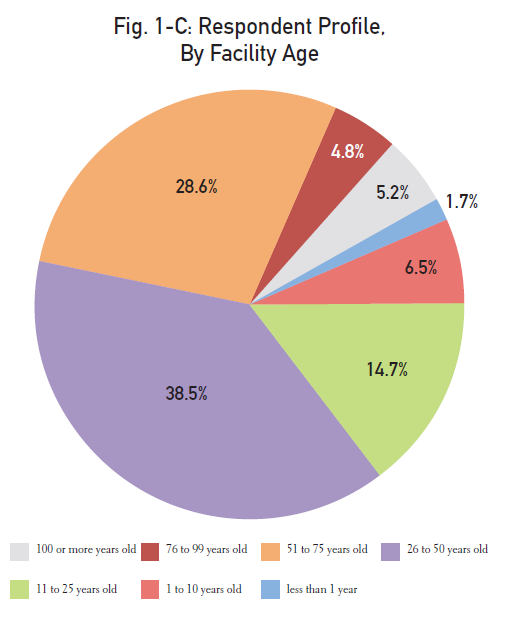
Facilities that answered the survey also ranged widely on facility age. The majority of facilities were between 26 to 50 years old, and large number were also between 51 to 75 years. A small number of facilities were less than one year old, while more than 5% were more than 100 years old. See Fig. 1-C.
Occupancy Rate
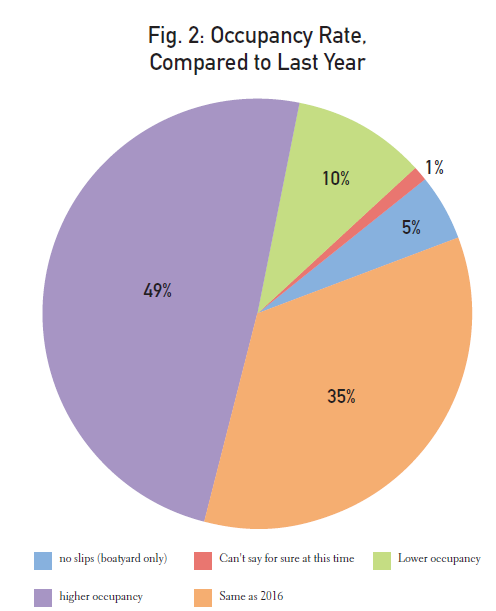
Almost half of facilities (49%) had higher occupancy in 2017, compared to the year before. A significant number had steady occupancy rates, and a much smaller number had lower occupancy, compared to 2016. See Fig. 2.
Slip/Service Rates
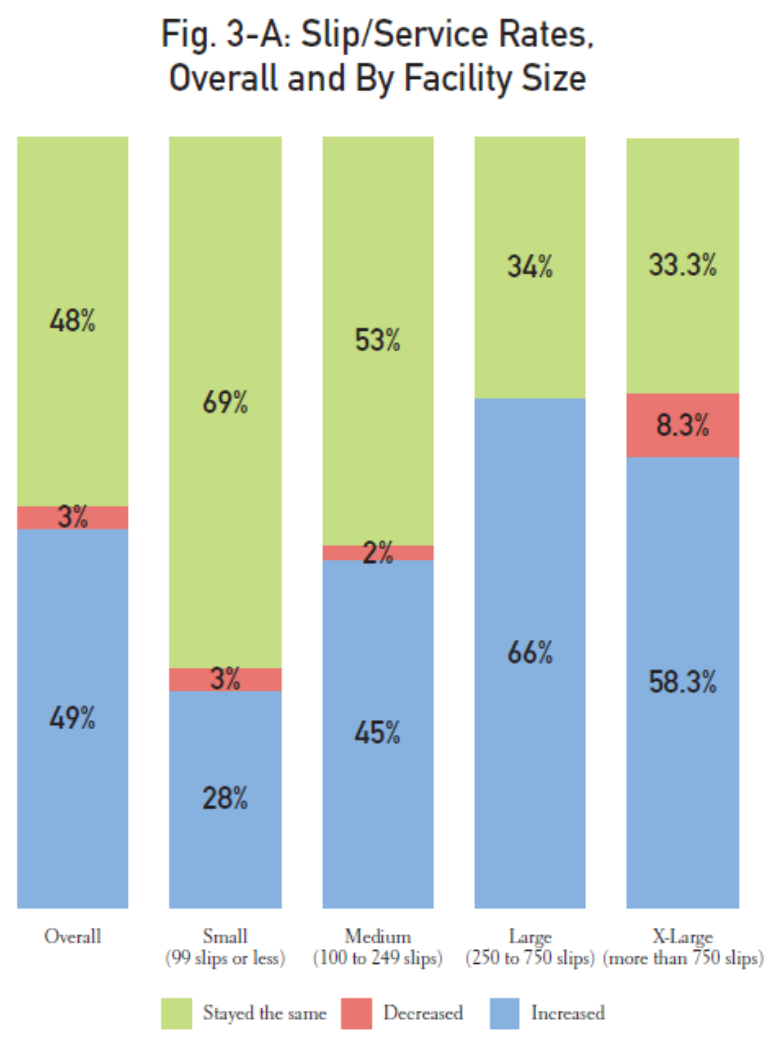
Fig. 3-A shows slip/service rates, compared to the year before, for the overall industry and by facility size. Small facilities had the lowest number with increased slips rates. Large and extra large facilities had a large number with increased rates, but extra large facilities also had the largest number with decreased 2017 rates. compared to the year before.
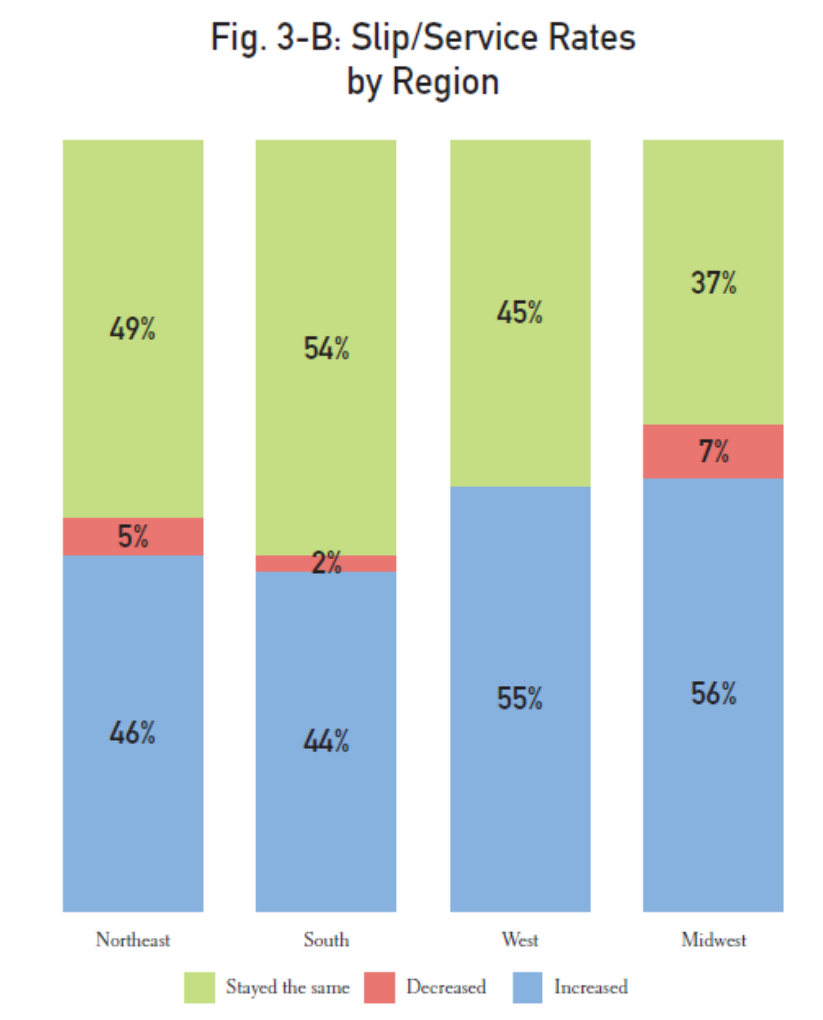
Looking at slip rates regionally, the numbers did not vary tremendously. The Midwest and the West had slightly more with increased rates. The Midwest also had the largest number with decreased rates. See Fig. 3-B.
Product/Service Revenues
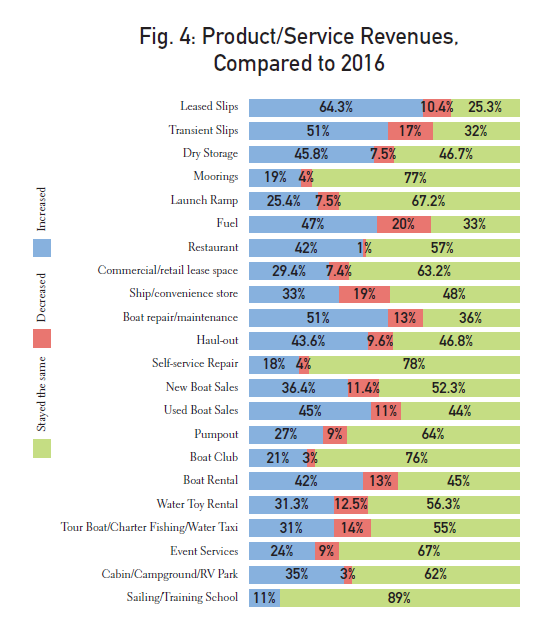
Fig. 4 shows the 2017 revenues, compared to the year before, for all product/service profitcenters. Leased slips showed the highest number with increased revenues. Transient slips, fuel, boat repair/maintenance and used boat sales were also high. For many of the products and services, 2017 revenues remained steady, compared to 2016.
Gross Profit
The majority of facilities reported a positive gross profit for 2017, more than three-quarters. Smaller facilities, those with 99 slips or less, had the fewest number with positive gross profits and the largest number who were uncertain about gross profits. Extra large facilities, those with more than 750 slips) had no facilities with negative profits, and a high number with positive gross profits. See Fig. 5-A.
Expenses
The majority of facilities increased expenses in 2017, compared to the previous year, and the results did not vary significantly across the different regions. Slightly more facilities increased expenses in the Northeast and the West. A slightly larger number (but still small minority overall) decreased expenses in 2017, compared to the year before. See Fig. 6.
| Categories | |
| Tags |


