Marina Trends Show Decade of Industry Growth
Published on November 12, 2019Editor’s Note: For some statistics, we have 10 years of data to report from Marina Dock Age surveys, dating back to 2009. This is a selection of the trends data on occupancy rates, gross profits, expenses and product/service revenues. More will be included in an upcoming Trends Report.
Occupancy Rate
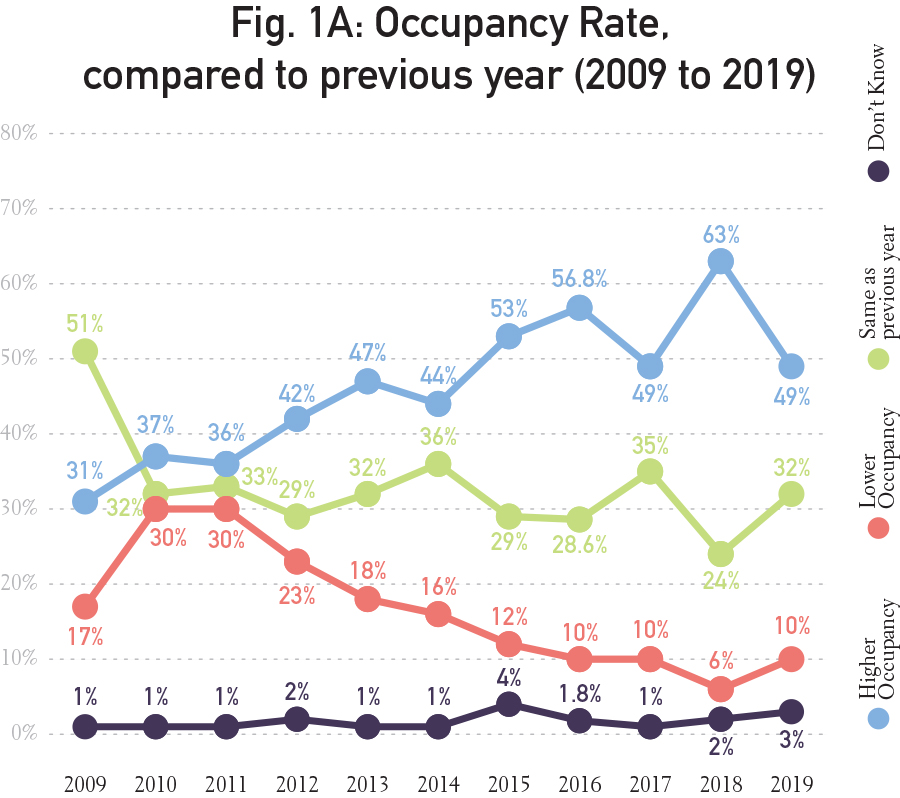
Those reporting increased occupancy rates continue to trend upward, despite a sharp drop this year. The numbers fluctuate year to year, but since 2009, increased occupancy rates have climbed by 18 percent. The number of facilities reporting decreased occupancy picked up slightly this year but is still steadily declining. Around one-third of facilities remain at a steady occupancy. See Fig. 1A.
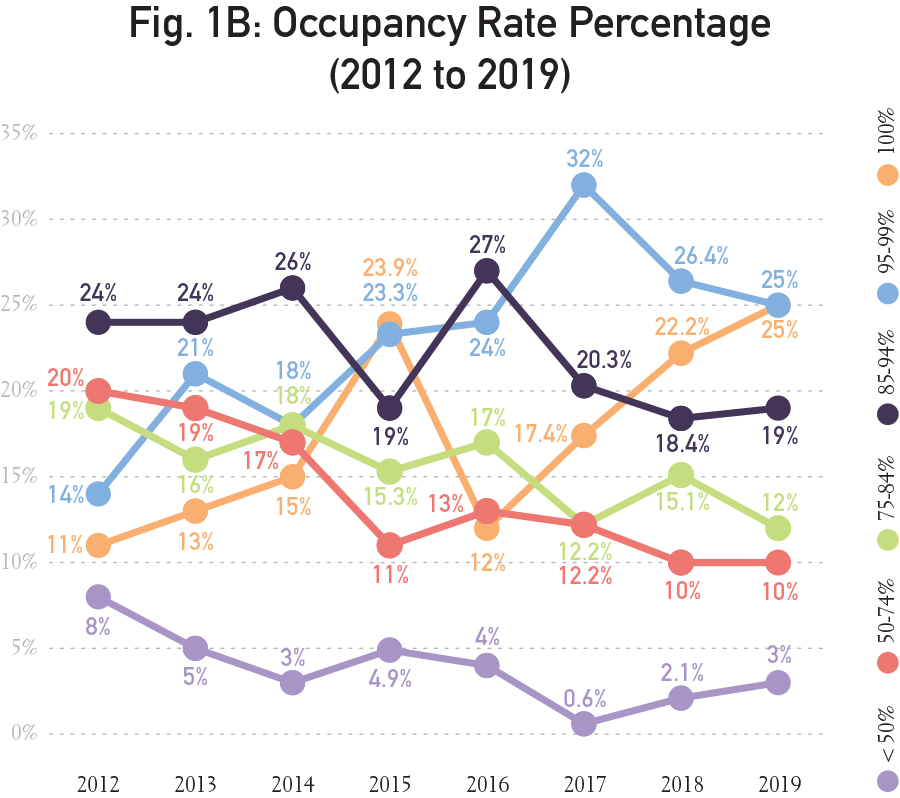
Fig. 1B shows the overall occupancy rate percentage from 2012 to 2019. More facilities are reporting 100 percent occupancy, on a sharp increase since 2016. Fewer facilities continue to report less than 50 percent occupancy.
Gross Profit
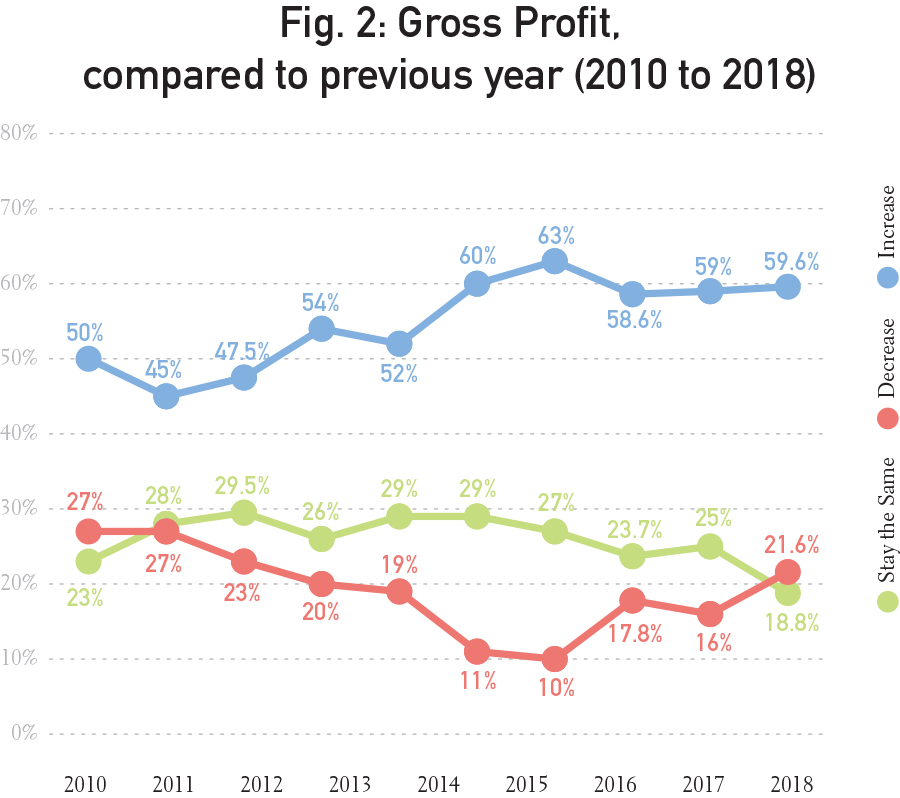
The number of facilities reporting increased gross profits remained at a high majority this year, up nearly 10 percent since 2010. This year an increase in the number of facilities reporting decreased gross profits overtook those reporting steady profits, for the first time since 2010. See. Fig. 2.
Expenses
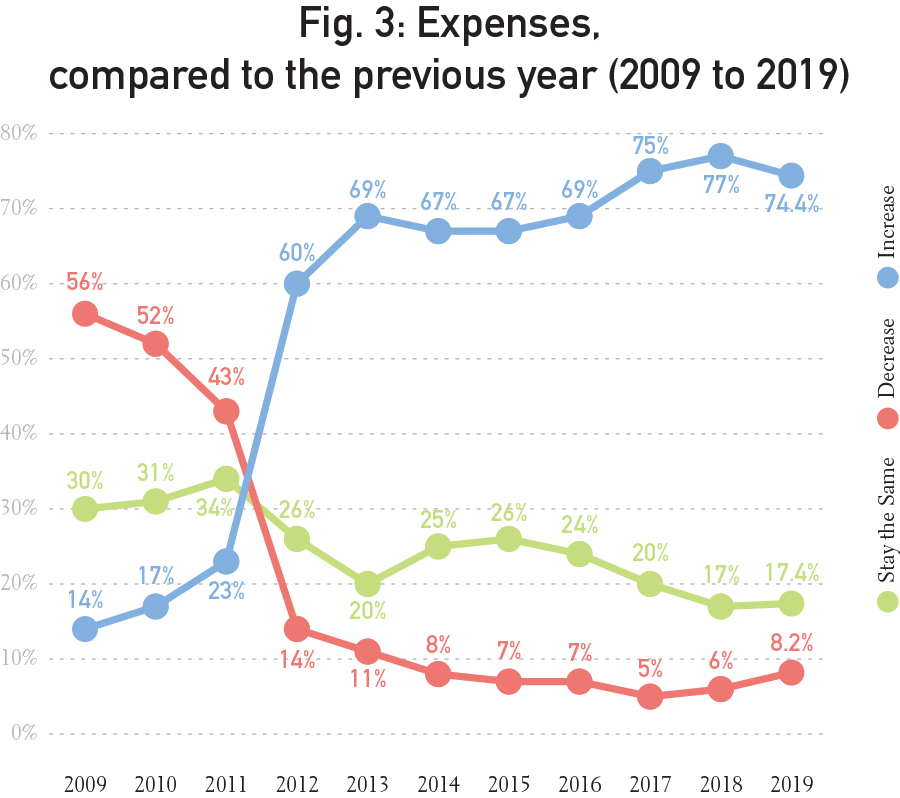
The number of facilities reporting decreased expenses rose slightly, matching a slight decrease in the number of facilities reporting increased expenses. A large majority of facilities still report increased expenses, compared to the year before. See Fig. 3.
Product/Service Revenues
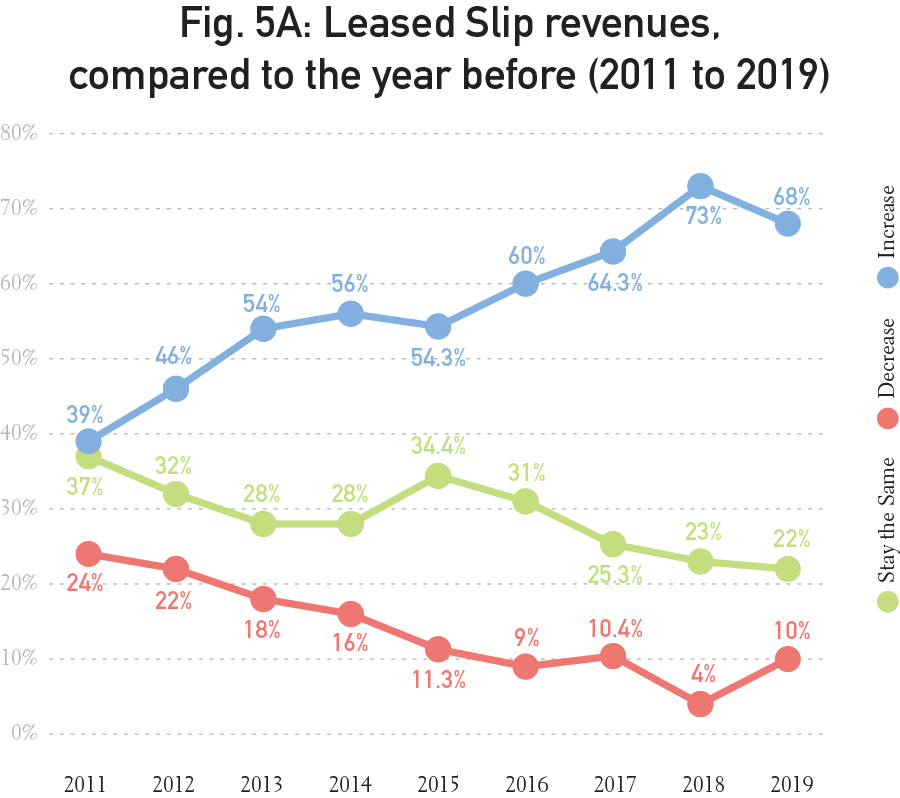
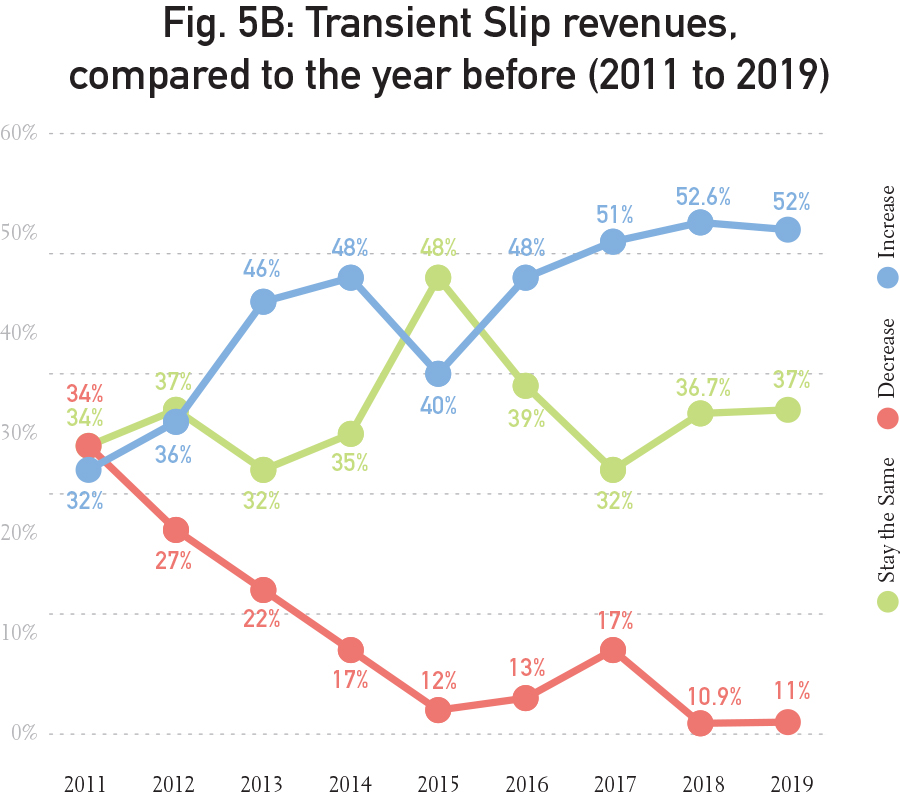
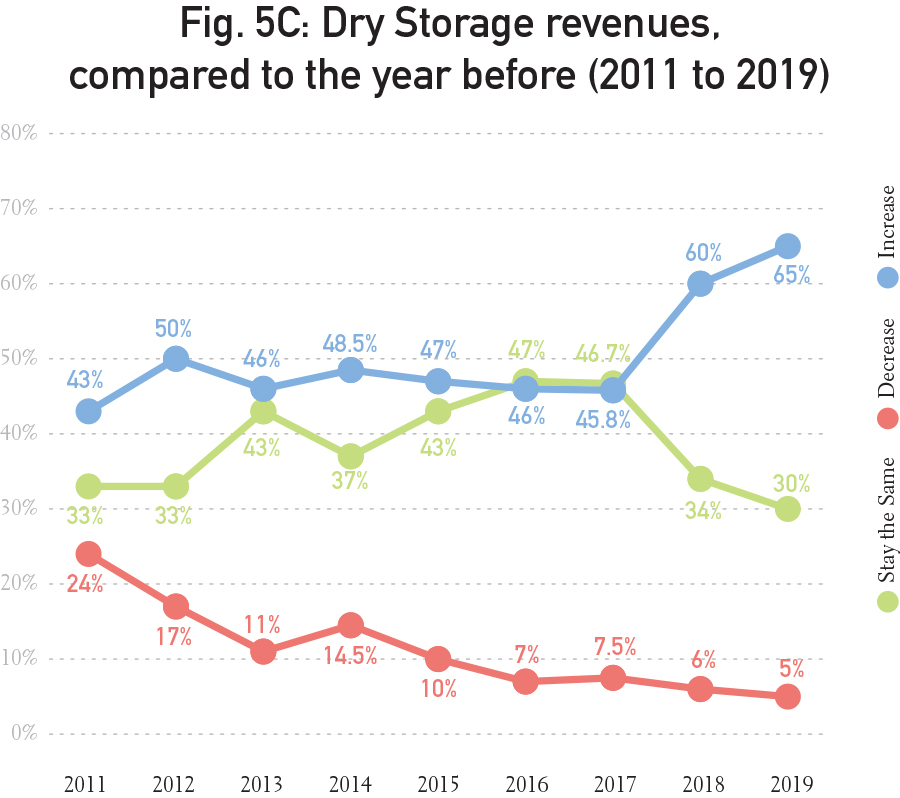
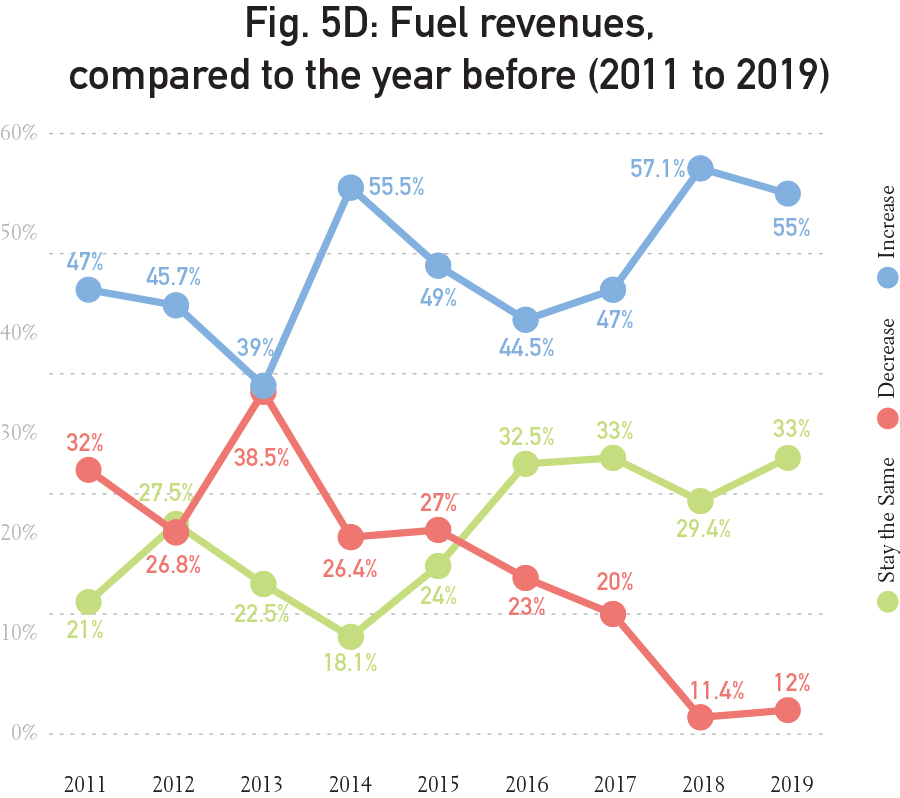
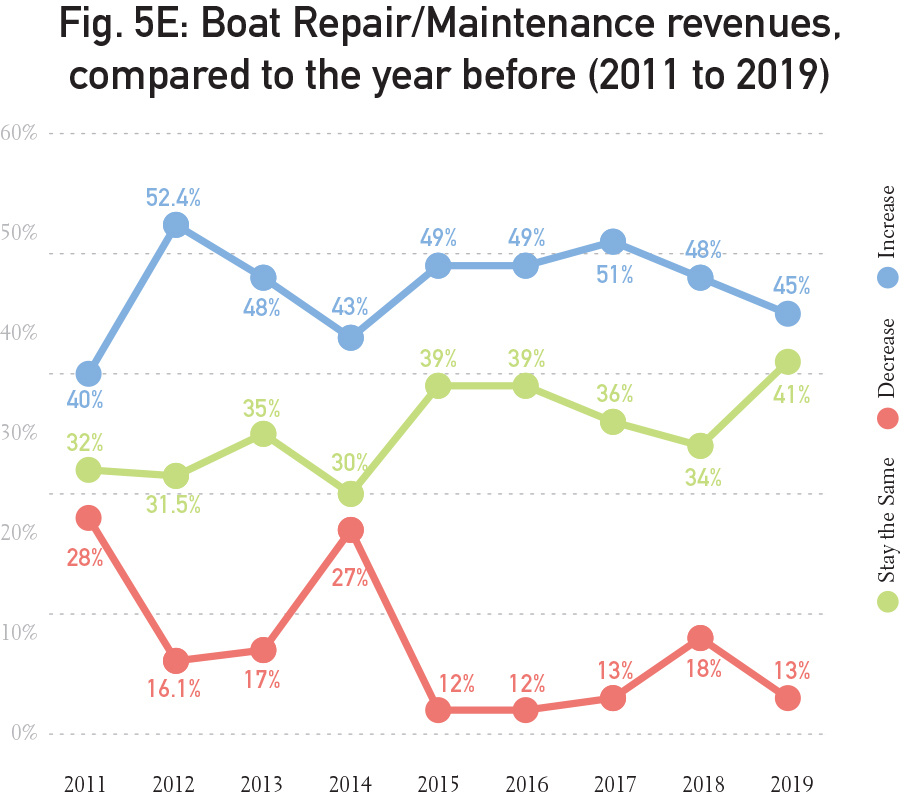
Figs. 5A-5E report on revenue numbers for a selection of products and services. They report on the number of facilities that indicated increased, decreased or steady revenues for 2019, compared to last year. Revenues on leased slips, transient slips, dry storage, fuel and boat repair/maintenance.
For more product/service revenue data and other trends statistics, look for the Trends Report in early 2020.
| Categories | |
| Tags |


