Marinas and Boatyards Answer Survey about Software and Technology Usage
Published on June 16, 2020Editor’s Note: In April and May 2020, Marina Dock Age surveyed marinas and boatyards across the country on their use of software for overall operations including customer communications, office management, finance and accounting and more.
Respondent Profile
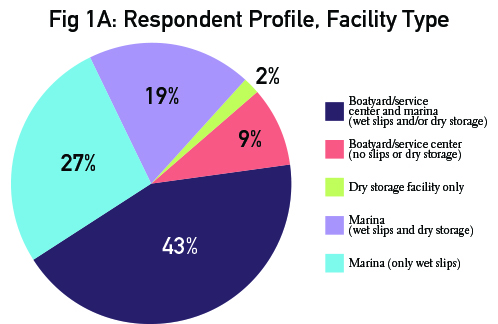
Figs. 1A to 1E identify the respondent profile of all those that answered the survey. Fig. 1A identifies the facility type and shows 43% of respondents have businesses that are a combination of marina and boatyard/service center. Another 27% identify as wet slip only marinas. Only 2% indicate they are a dry storage only site.
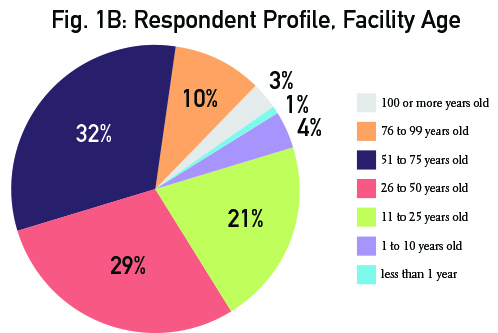
Fig. 1B shows the respondent profile by facility age. The majority of respondents (61%) have facilities that are between 25 and 75 years old. The oldest and youngest facilities represent the lowest numbers; only 1% of facilities are less than 10 years old and only 3% are older than 100.
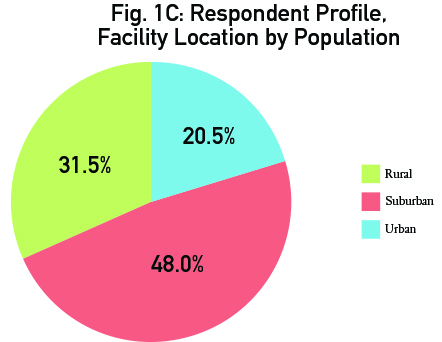
Fig. 1C identifies facilities based on local population numbers (urban vs. rural vs. suburban). The majority of respondents (48%) are located in suburban areas, with another 31.5% in rural areas and 20.5% in urban areas.
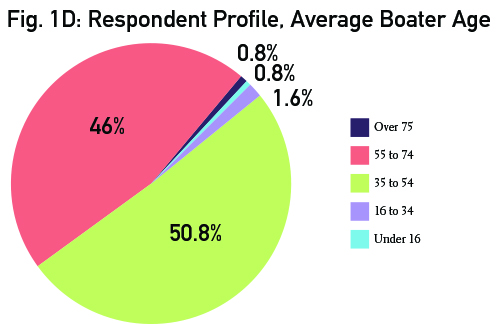
Fig. 1D indicates the age of boating customers. The majorities are in the 35 to 54 (50.8%) and 55 to 75 (46%) age brackets.
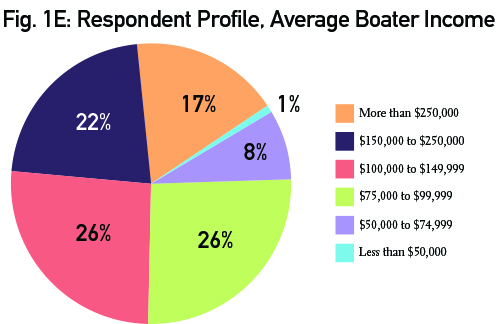
Fig. 1E shows the respondent profile by average boater income. The majority of respondents (52%) indicate that their customers’ incomes range between $75,000 and $149,999. An additional 22% are in the $150,000 to $250,000 income range. Only 9% have customers with incomes less than $75,000.
Profit Centers
Fig. 2 shows what profit centers facilities managed through a software program, looking at the overall numbers and how that varied by location. More facilities use software to manage wet slips and dry storage, than other profit centers, followed by ships’ store/point-of-sale. Fewer facilities use software to manage boat sales and rentals. Rural areas seem to make the most use of software across their profit centers.
Finance/Accounting
The Fig. 3 chart shows how software is used for finance and accounting procedures. The largest number (91%) use software for billing, then accounting (85%). Only about 27% of facilities use software for security or time clock integration.
Office Management
The Fig. 4 chart shows how software is used for office management. The majority of facilities (73%) communicate to customers through technology, and 68% of facilities use software for customer contracts. Only 16% of facilities use technology for vessel monitoring.
Customer Online Access
Fig. 5 shows what percentage of facilities offer different online account services for customers. Urban locations show a higher offering of online customer access services than suburban locations. Forty-two percent of urban facilities use software for account communication with customers. Fewer facilities use software to offer finance charge assessment and online contracts for customers.
Vessel Maintenance/Repair
The Fig. 6 chart identifies what facilities use software to manage vessel maintenance/repair. The largest number of facilities (45%) use software for work order management, while only 20% use it for warranty management. Forty-four percent also use it for inventory and parts management.
Operational Platform
Fig. 7 shows what operational platforms facilities use for software management. The majority (59%) use an on-site platform; 31% are cloud-based, and only 19% use a hosted server.
| Categories | |
| Tags |


