Part Two: 2019 Industry Survey Results
Published on January 15, 2020Editor’s Note: In late 2019, Marina Dock Age magazine conducted the annual marina/boatyard industry survey. Nearly 300 facilities answered the online survey. The first batch of results appeared in the November/December 2019 issue. Thank you to our industry sponsors who helped promote engagement with the industry for this important free resource (Colliers International, Dockwa, Massachusetts Marine Trades Association, Marine Recreation Association, Marine Trades Association of New Jersey, Northwest Marine Trades Association, and Rhode Island Marine Trades Association. In early 2020, look for the Trends Report, which compiles marina industry statistics from the past decade.
For more results on regional occupancy rates, wet/dry slip and maintenance rates and gross profits, and the results by facility age and facility size, see the November/December issue 2019 issue, page 6.
Respondent Profile
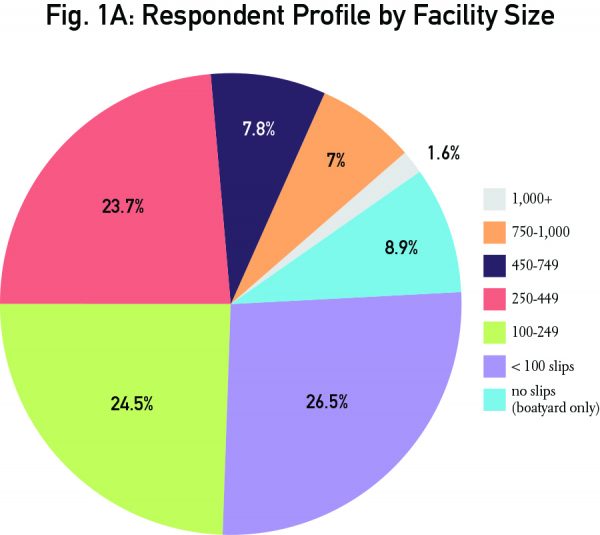
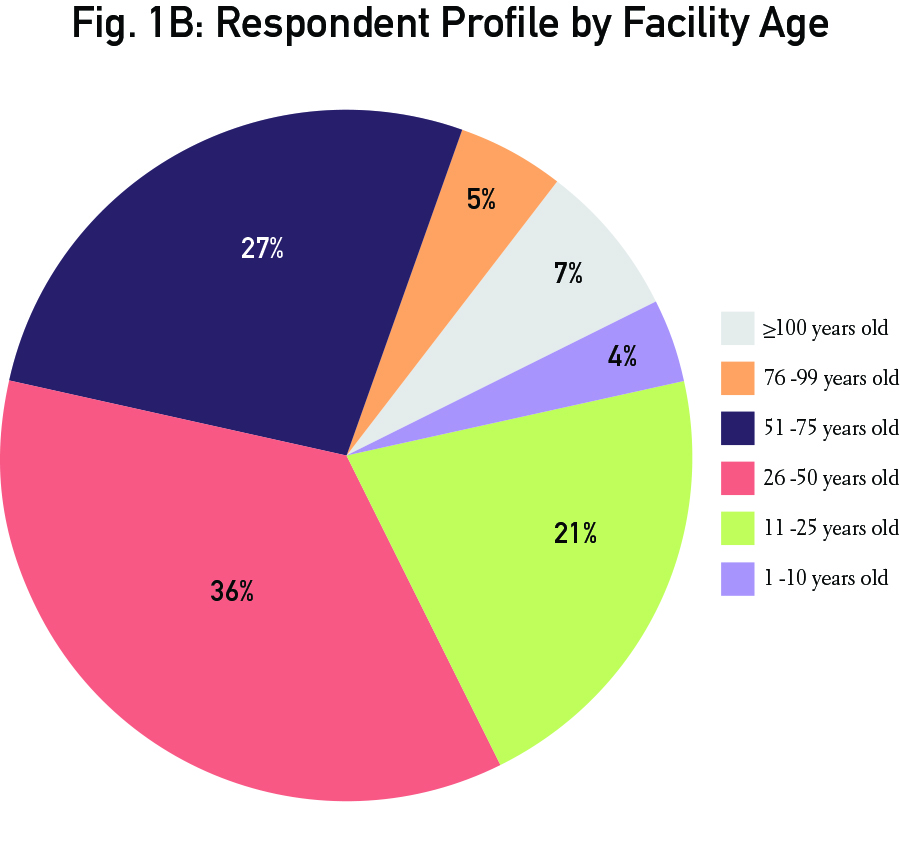
Fig. 1A shows the overall respondent profile by facility size. Nearly one-quarter of facilities are less than 100 slips (26.5%); 100 to 249 slips (24.5%); and 250 to 449 slips (23.7%). Fig. 1B shows the facilities by age. The majority of facilities (36%) are 26 to 50 years old. More than one-quarter (27%) are facilities that are 51 to 75 years old.
Occupancy Rate
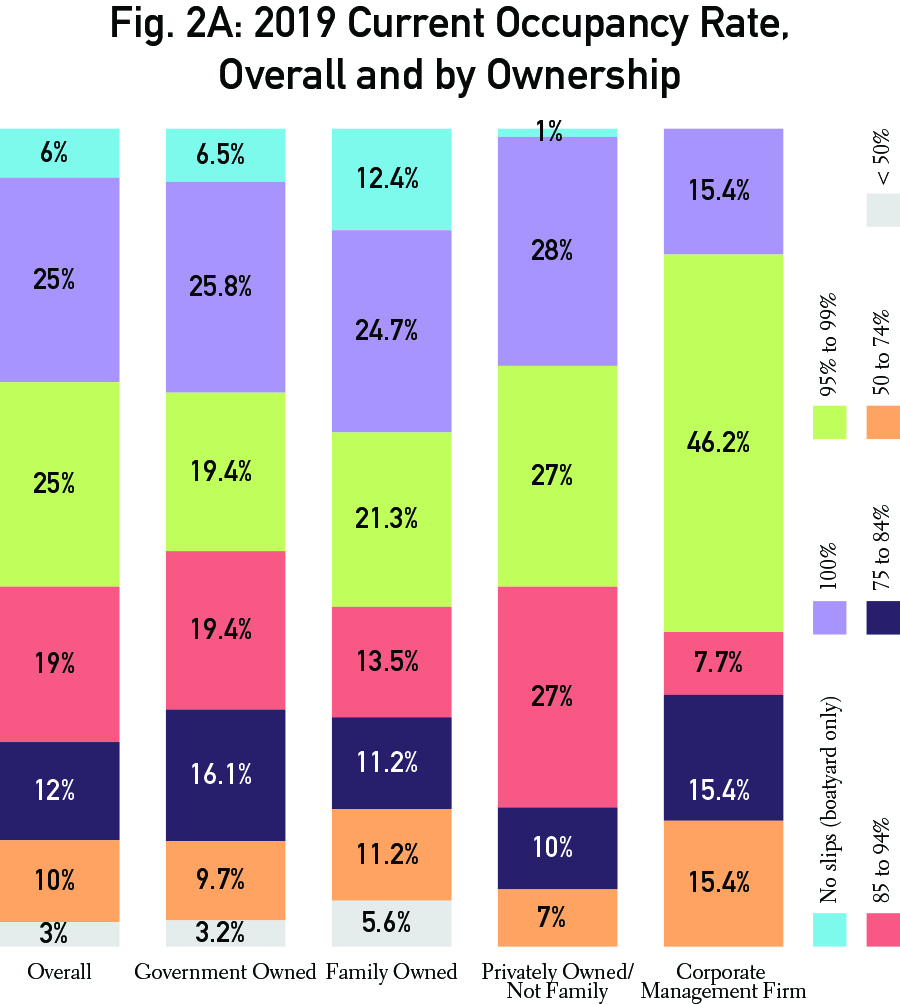
Fig. 2A identifies the current occupancy rate in 2019 for facilities overall and by ownership type. While a fair number of facilities have occupancy rates below 95 percent (44%), the largest number have occupancy rates at 95 percent or above (50%).
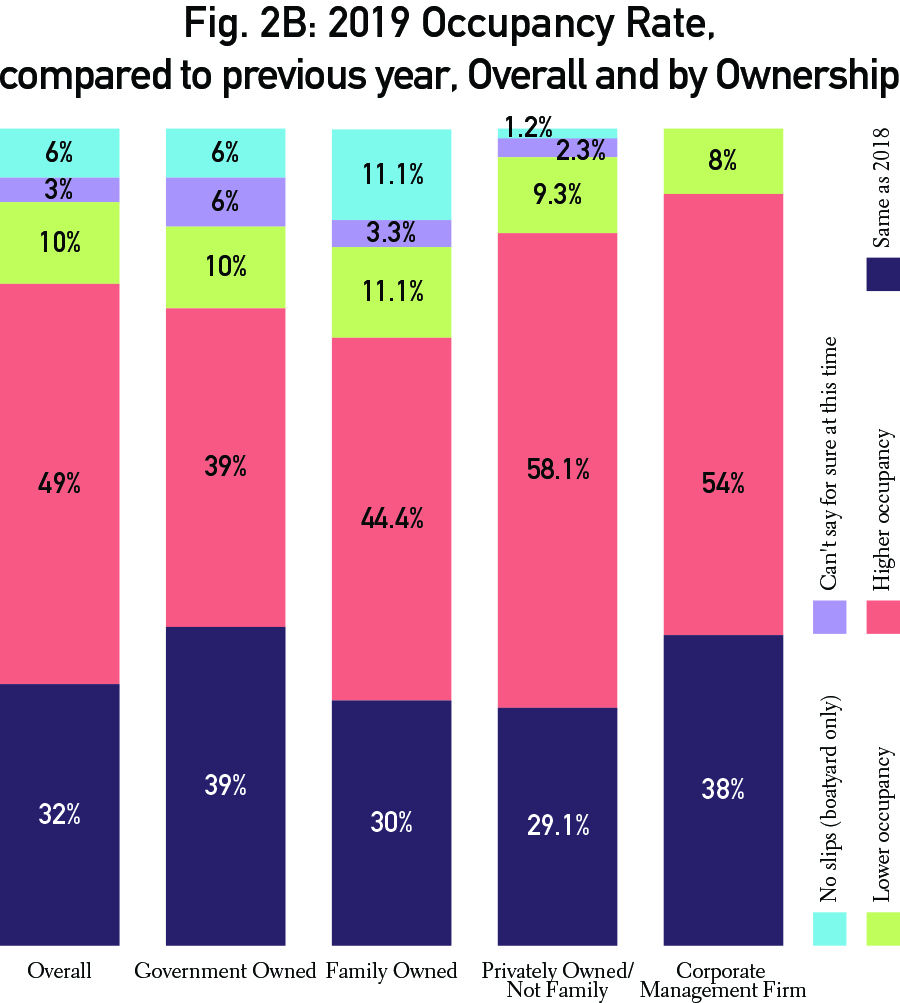
Fig. 2B shows the overall occupancy rates for 2019, compared to the previous year, and by ownership. The majority of facilities in all categories had higher occupancy rates in 2019.
Product/Service Revenues
Fig. 3 shows 2019 product and service revenues, compared to the previous year. The majority has indicated that profits were steady for 2019, compared to the previous year. Product and services that showed a majority with increased revenues for 2019: Boat Repair/Maintenance (45.2%); Ship/Convenience Store (43.5%); Fuel (55%); Dry Storage (65%); Transient Slips (52%); Leased Slips (68%).
Expenses
Fig. 4 shows 2019 expenses compared to the previous year. The large majority show increased expenses (74.4%).
Gross Profit
Fig. 5 indicates the overall 2019 gross profit, compared to the previous year, as well as by ownership type. The majority show increased profits, 59.6% overall. Corporate management firms have the largest majority with increased profits.
| Categories | |
| Tags |


