Regional Statistics on Marina Operations Show Range of Dockage Offerings
Published on May 2, 2019Editor’s Note: Earlier this year, Marina Dock Age surveyed marinas and boatyards about their operations, (infrastructure, rates, employee training and more.) This second part of the survey results shows regional statistics. For more survey results, see the MDA April 2019 issue, page 10.
Respondent Profile
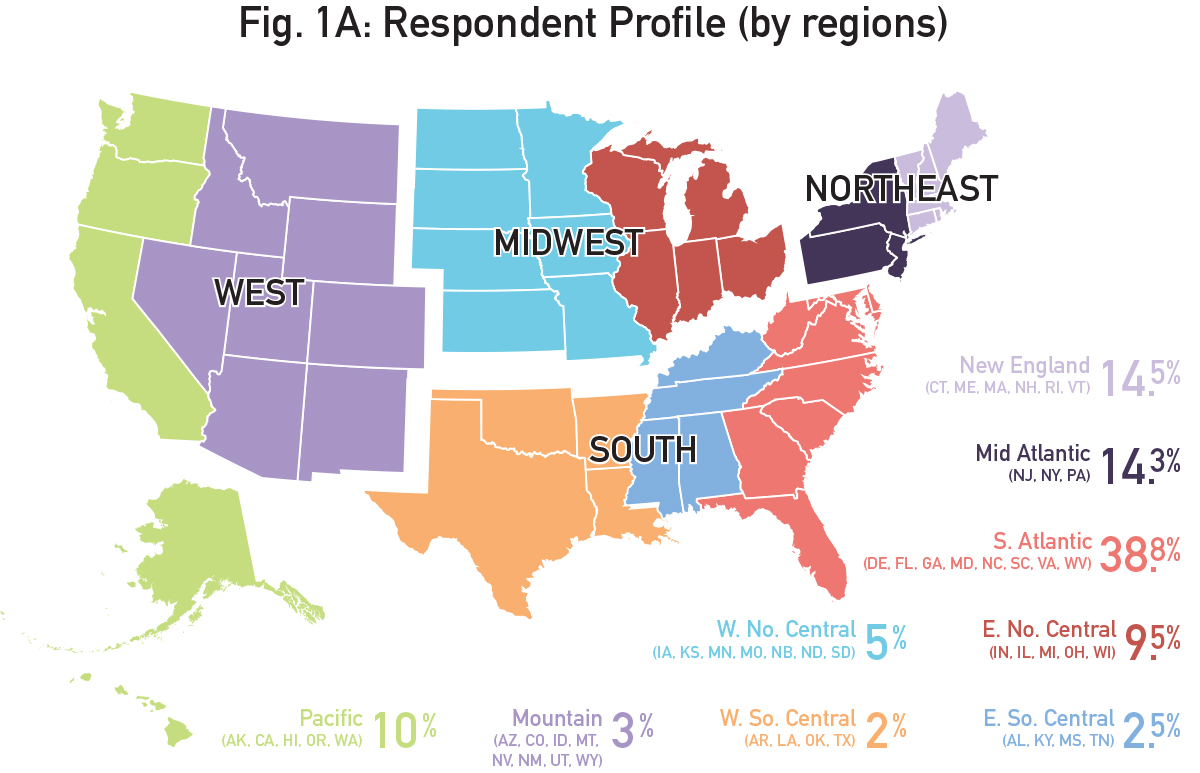
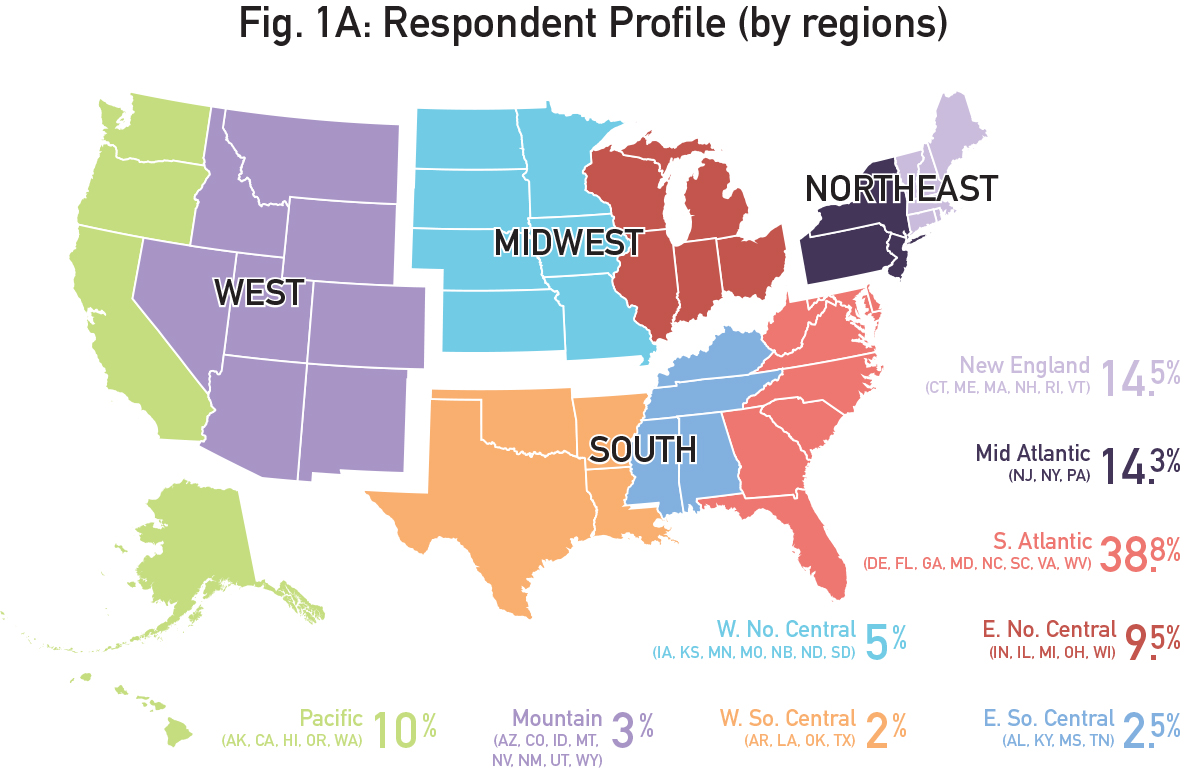
The Fig. 1 map shows the respondent profile by regions. The South represents the largest number of respondents at about 43%, followed by the Northeast. The Southern region is largely made up of facilities in the South Atlantic region.
Dockage Types, Terms and Charges
Fig. 2 shows the different types of dockage available at facilities, overall and in each region. The majority of facilities offer slips (72%), then side-tie docking
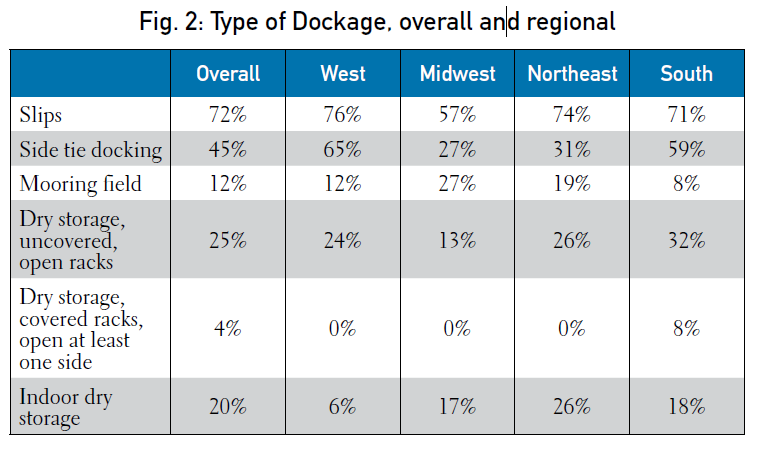
(45%). Fewer facilities in the Midwest offer slips than other regions. Side-tie dockage also varies greatly across the regions. Indoor dry storage is most popular in the Northeast region (26%).
Fig. 3 identifies what length of dockage terms that facilities offer. Overall, about half the respondents offer each annual, seasonal, transient and month-to-month terms. The South offers the most annual term contracts for boaters (69%) and the Northeast offers the fewest (17%). A large number of facilities in the West, Northeast and South offer transient dockage, compared to the Midwest.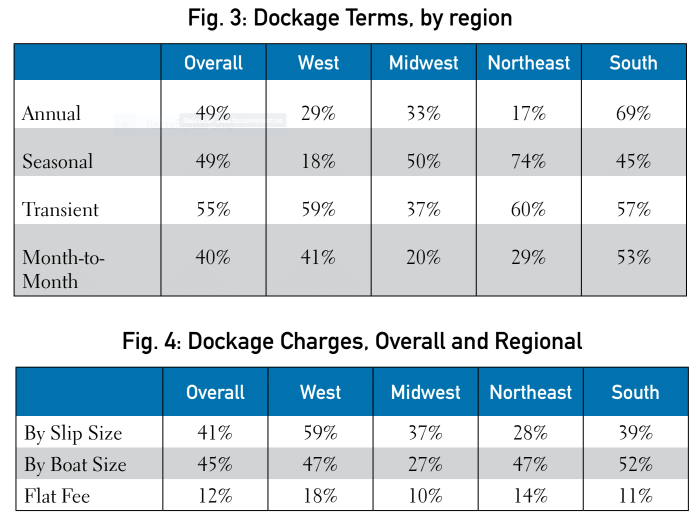
Fig. 4 looks at how facilities charge for dockage (by slip size, by boat size or flat fee). A much larger number of facilities in the West charge by slip size, compared to the other regions. Fewer facilities overall offer flat fee dockage.
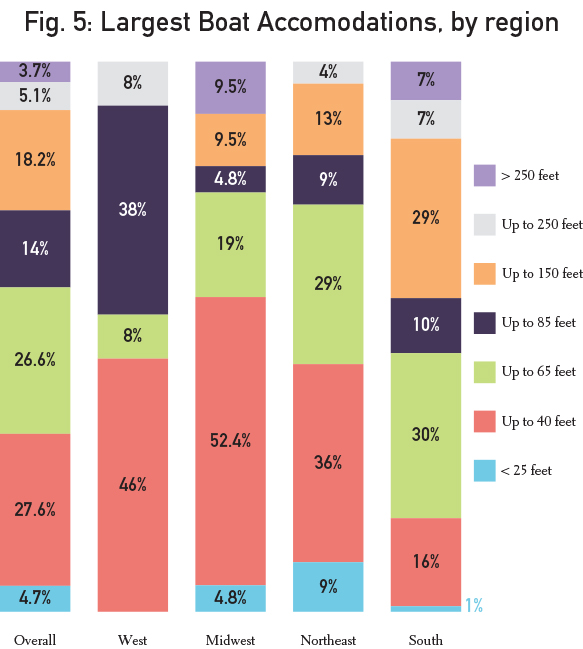
Fig. 5 shows the largest size boats that facilities can accommodate. The results vary greatly across the regions. Midwestern facilities offer a wide range of boat sizes, from less than 25 feet to more than 250 feet. The West offers mostly slips in the 40 to 85-foot range. The South has the largest number of facilities offering slips for boats 150 feet and larger.
Infrastructure/Renovations
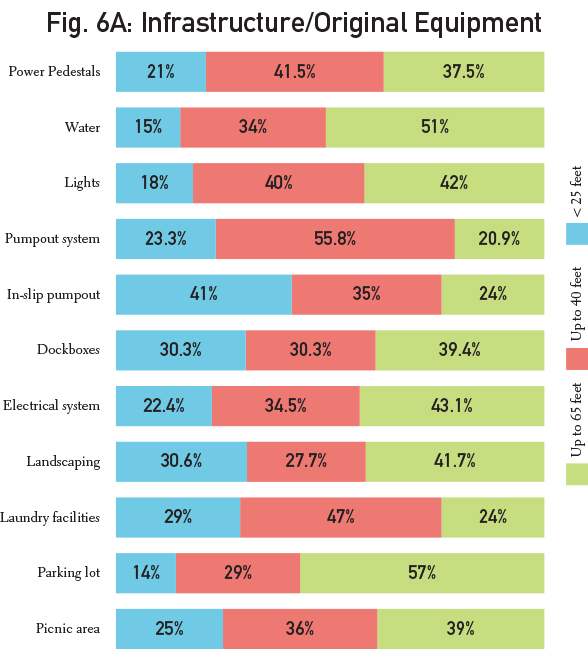
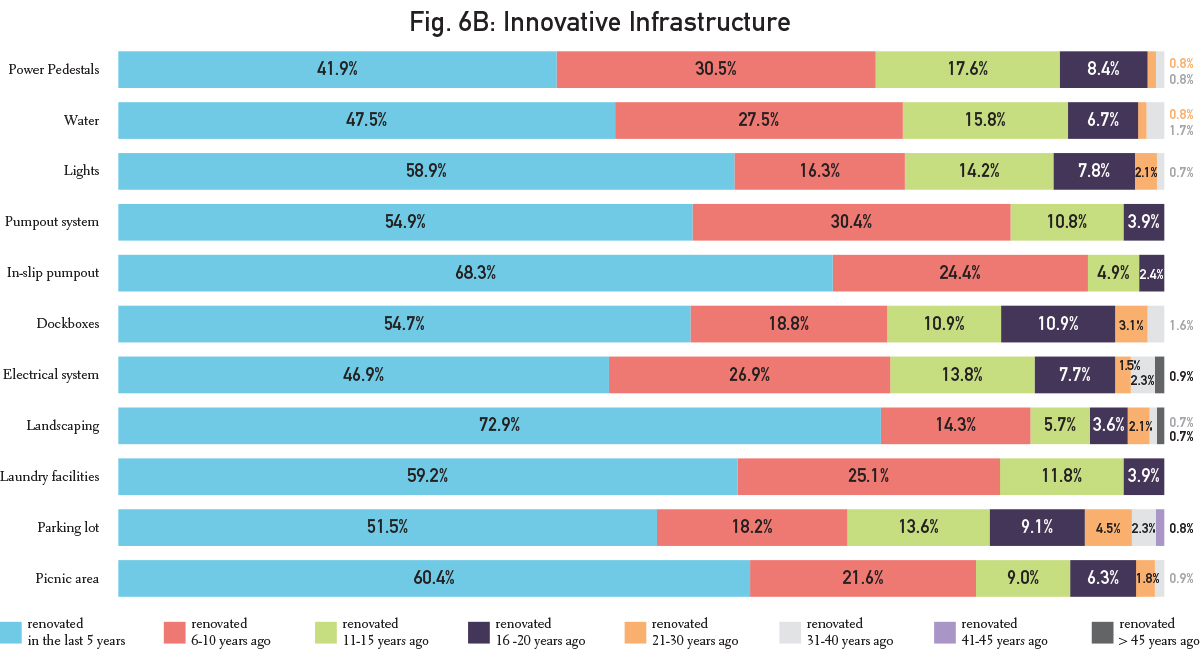
Fig. 6A shows some of the infrastructure that facilities identify as original equipment and how old it is. The majority of facilities with original equipment have had that infrastructure for 6 to 15 years. Fig. 6B shows the infrastructure that facilities have renovated and how long ago. Most of the renovated infrastructure was done in the last five years. A significant number of facilities identified infrastructure that was renovated 6 to 10 years ago. (For a look at other infrastructure and renovations, see the MDA April issue report.)
| Categories | |
| Tags |


